NPT is proud to publish our 12th annual Donor-Advised Fund Report.
Our 2018 Donor-Advised Fund Report examines 2013 through 2017 fiscal year data from 1,002 charities. For the eighth consecutive year, there was growth in all key metrics—number of individual donor-advised funds, total grant dollars from them, total contributions to them and total charitable assets in them.
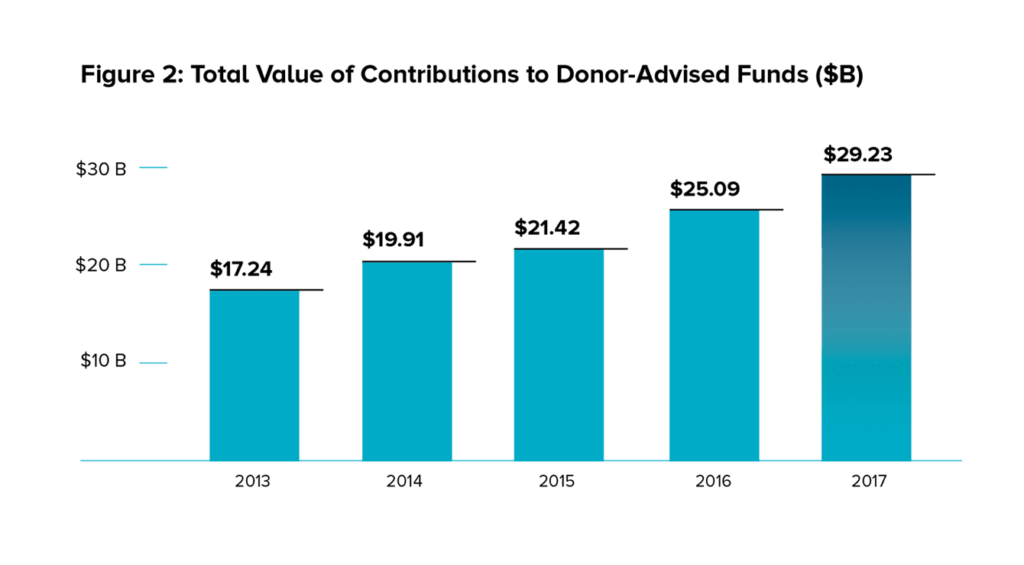
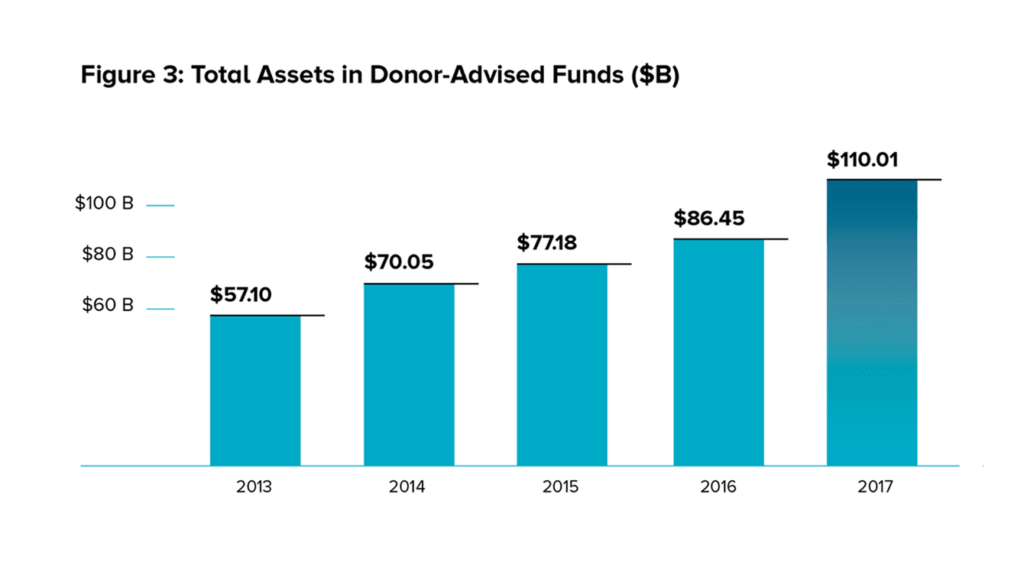
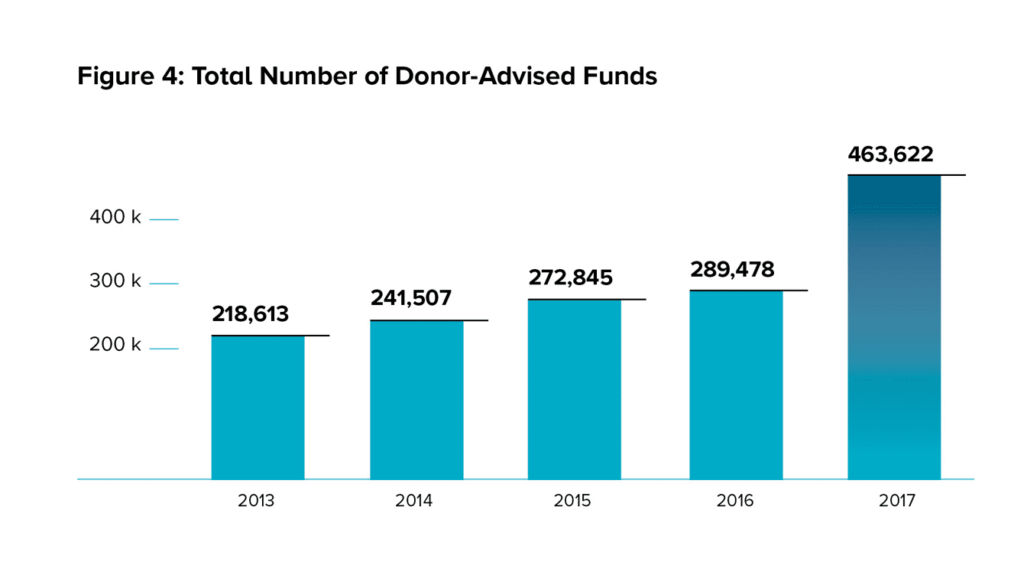
In 2017, there were 463,622 individual donor-advised funds across the country. Donors contributed $29.23 billion to these donor-advised funds and used them to recommend $19.08 billion in grants to qualified charities. Both grants and contributions reached record highs. Charitable assets in donor-advised funds totaled $110.01 billion, surpassing the $100 billion mark for the first time.
While these record-breaking totals are significant, the rates of change are even more interesting. For example, grants from donor-advised funds to qualified charities increased nearly 20 percent from 2016 to 2017, a faster rate of growth than almost every year prior. Contributions rose 16.5 percent in that same time, which is a healthy rate of growth, but slower than the prior year.
What our previous reports predicted and what I’ve observed is that donors who create donor-advised funds are actively making grants. We see that through the growth in grants to donors’ favorite charities. The simultaneous growth in contributions indicates that this pattern will continue.
The number of individual donor-advised funds grew an astounding 60.2 percent from 2016 to 2017, largely due to the launch of one new donor-advised fund program. Charitable assets increased 27.3 percent in that same time. As a result, the average account size decreased by 20.5 percent. These rates of change indicate a high volume of donor-advised funds being opened with lower account balances. Emerging models for using donor-advised funds, including crowdfunding and workplace giving, underscore the many ways that individuals and charitable sponsors use this flexible giving vehicle.
The evolution and growth of donor-advised funds in the U.S. reflect the importance and value Americans place on philanthropy.
Regards,
Eileen R. Heisman
President & CEO
About this Report
Donor-advised funds are one type of charitable giving vehicle that enables donors to reach their philanthropic goals. The rapidly increasing number of individual donor-advised fund accounts make them the fastest-growing vehicle in philanthropy; and the rising value of charitable dollars granted from donor-advised funds also makes them the most active type of charitable giving vehicle. National Philanthropic Trust provides this report as a public service to those who are interested in this important charitable giving vehicle.
National Philanthropic Trust began tracking donor-advised fund data in 2007. Since that time, we have analyzed 61 National Charities, 620 Community Foundations, and 390 Single-Issue Charities for a total of 1,071. The 2018 Donor-Advised Fund Report relies on data from 1,002 of those charitable sponsors. We perform regular audits of our database of donor-advised fund charitable sponsors, adding new charitable sponsors and removing closed ones each year. We also compare our database against all charities that complete the IRS 990 Form Schedule D, which specifically related to donor-advised funds. We study and verify the accuracy of the filings before adding the organization to our database.
Charitable Sponsors Examined in this Report
53
national charities
604
community foundations
345
single-issue charities
Purpose and Scope
This report provides an up-to-date analysis of donor-advised funds. It is based on data collected during the second and third quarters of 2018 about donor-advised funds and the charities that operate them in fiscal year 2017. This report analyzes data from 1,002 charitable sponsors. Additional data came from audited financial statements, annual reports, organizational websites and news releases.
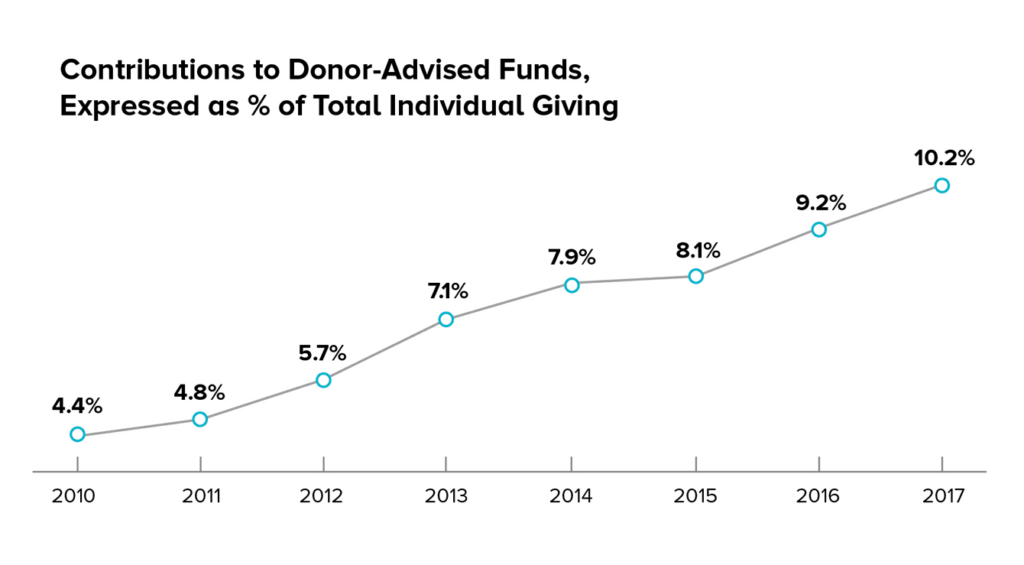
Total estimated charitable contributions in the United States in 2017 were $410.02 billion according to Giving USA. Individual giving accounted for $286.65 billion, or 70 percent of all charitable giving in the U.S., in 2017. Contributions to donor-advised funds have increased as share of total giving over the past decade. For 2017, donors contributed $29.23 billion, or the equivalent of 10.2 percent of individual giving.
Glossary of Terms
Charitable Assets
The dollar amount charitable sponsors hold and manage in donor-advised funds. Some charitable sponsors manage other types of funds as well. This report is limited to assets in donor-advised funds.
Charitable Organization
A tax-exempt organization registered with the IRS and recognized under Section 501(c)(3) of the Internal Revenue Code. Donations to a charitable organization are tax-deductible to the donor, when the donor claims deductions on income taxes. A charitable organization serves broad public purposes in educational, religious, scientific and artistic fields, among others, as well as the relief of poverty and other public benefit activities. In the context of this report, a charitable organization can be either a charitable sponsor of donor-advised funds or the recipient of a donor-advised fund grant.
Charitable Sponsor
A tax-exempt charitable organization that manages donor-advised funds. Charitable sponsors provide services to ensure that potential grant recipients are qualified charitable organizations and administer donor-advised funds to ensure compliance with all regulations. Also called sponsoring charity or fund sponsor.
Community Foundation
A tax-exempt organization that raises funds from the public. Most Community Foundations, both trust and corporate forms, qualify as publicly supported charities under IRC 509(a)(1) and 170(b)(1)(A)(vi). It is a philanthropic institution with a long-term goal of engaging many separate donors to carry out charitable interests for the benefit of residents of a defined geographic area, typically no larger than a state.
Compound Annual Growth Rate
The compound annual growth rate is a useful measure of growth over multiple time periods. It can be thought of as the growth rate that gets you from the initial value to the ending value if you assume that the value has been compounding over the time period.
Contribution
Amount a donor gives to a donor-advised fund when establishing the fund or adding money to it.
Donor-Advised Fund
A philanthropic giving vehicle administered by a charitable sponsor. A donor-advised fund allows donors to establish and fund the account by making irrevocable, tax-deductible contributions to the charitable sponsor. Donors then recommend grants from those funds to other charitable organizations.
Grant
A transfer of assets from a donor-advised fund to a qualified charitable recipient.
National Charity
A tax-exempt organization with a national focus in fundraising and grantmaking. National Charities include independent organizations, such as National Philanthropic Trust, and other charitable organizations affiliated with financial institutions.
Grant Payout
The percentage of total charitable assets at the end of one year that any one type of charitable sponsor or all charitable sponsors grants from a donor-advised fund to qualified charities and charitable projects. Grant payout in this report is calculated as grants made in the current year divided by donor-advised fund assets held at the end of the prior year.
Private Foundation
A tax-exempt organization recognized under Section 501(c)(3) of the Internal Revenue Code formed and controlled by a donor or small group of donors for the purpose of distributing money to charitable organizations or individuals. In this report, corporate foundations are not included in the definition.
Single-Issue Charities
A tax-exempt organization that works in a specific topic area. Some common Single-Issue Charities include universities, Jewish federations, other faith-based charities and issue-specific charities, such as those in the environmental, social justice or international relief arenas.
Market Overview
This fiscal year saw a booming stock market and engagement in important public policy issues, both of which played a role in charitable activity. Fiscal Year 2017, which we analyze in this report, began as early as July 1, 2016 for some charities and ended as late as December 31, 2017 for others. This 18-month period was marked by a U.S. presidential election cycle; President Trump’s first year in the White House; Congressional tax reform; a devastating hurricane season in the U.S. and the Caribbean; the acceleration of the #MeToo movement; and several major humanitarian crises, including famine in several African nations.
Economic indicators also play an important role in charitable giving throughout the year. The Standard & Poor’s 500 (S&P Index) rose by 18.4 percent, or 415.78 points, in calendar year 2017.[1] This growth is important to note because charitable giving scholars have found that the “strongest predictor [of individual giving] is the S&P index…a 100 point increase in the index is associated with a $1.7 billion increase in charitable deductions.”[2] The U.S. economy, as measured by Gross Domestic Product, grew by 2.6 percent for 2017,[3] up from growth of 1.5 percent in 2016 (adjusted for inflation);[4] and the official unemployment rate fell further in 2017 to 4.1 percent, down from 4.7 percent the prior year.[5]
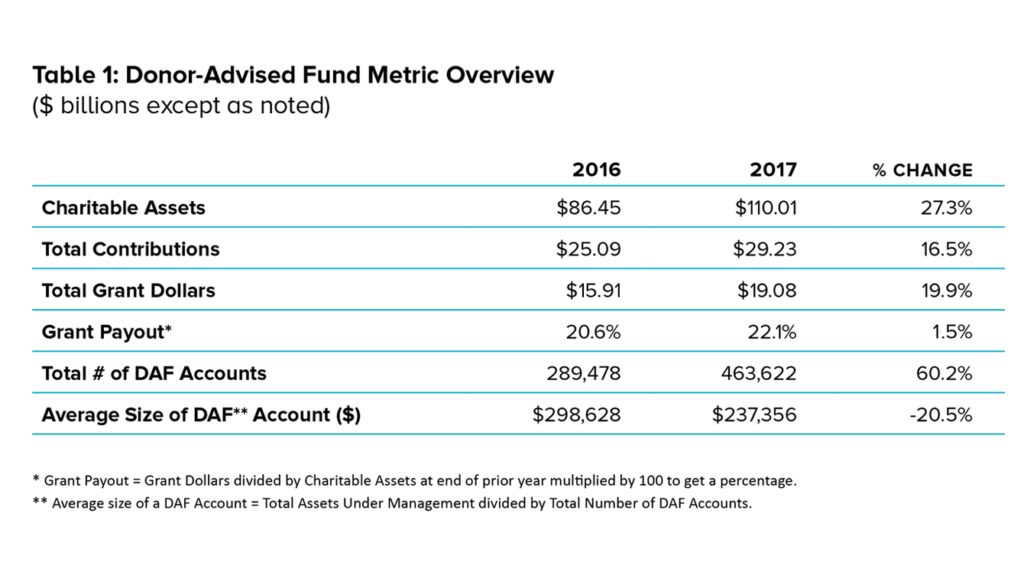
In 2017, donor-advised funds saw continued growth in every metric, including grant dollars, contributions, charitable assets and number of donor-advised funds (Table 1).
Of Note:
- Grants from donor-advised funds to qualified charities totaled an estimated $19.08 billion, representing an increase of 19.9 percent compared to 2016, which is revised to $15.91 billion. The compound annual growth rate from 2012 through 2016 was 16.8 percent.
- Contributions to donor-advised funds increased by 16.5 percent to $29.23 billion, compared to the prior year’s revised contribution total of $25.09 billion. The compound annual growth rate from 2012 through 2016 for contributions was 15.7 percent.
- Charitable assets in donor-advised funds grew from $86.45 billion in 2016 to $110.01 billion in 2017, a 27.3 percent increase. From 2012 through 2016, charitable assets rose by a compound annual growth rate of 17.9 percent. Growth in 2017 includes contributions and investment yield.
[1] MarketWatch, “Stocks end an otherwise stellar 2017 on a down note,” December 29, 2017. https://www.marketwatch.com/story/dow-sp-set-to-power-to-fresh-record-on-2017s-last-trading-day-2017-12-29, accessed October 10, 2018.
[2] Deb, P., Wilhelm, M.O., Rooney, P.M. and Brown, M.S., 2003. Estimating charitable deductions in giving USA. Nonprofit and Voluntary Sector Quarterly, 32(4), pp.548-567. http://journals.sagepub.com/doi/abs/10.1177/0899764003258502, accessed October 28, 2018.
[3] J. Stein “U.S. economic growth slowed in 2017’s fourth quarter, missing Trump’s targets,” Washington Post, January 26, 2018. https://www.washingtonpost.com/business/economy/the-us-economy-grew-23-percent-in-2017-as-growth-slowed-in-fourth-quarter/2018/01/26/ee7efb56-029a-11e8-bb03-722769454f82_story.html?utm_term=.f5138aca725e, accessed October 10, 2018.
[4] Statista, “Real GDP growth of the United States, 1990 to 2017,” https://www.statista.com/statistics/188165/annual-gdp-growth-of-the-united-states-since-1990/, accessed October 10, 2018.
[5] U.S. Bureau of Labor Statistics, “Databases, Tables & Calculators by Subject,” Labor Force Statistics from the Current Population Survey, Unemployment rate by month, 2008 through 2018. December of 2017 and December of 2016. https://data.bls.gov/timeseries/LNS14000000, accessed October 10, 2018.
Comparison to Private Foundations
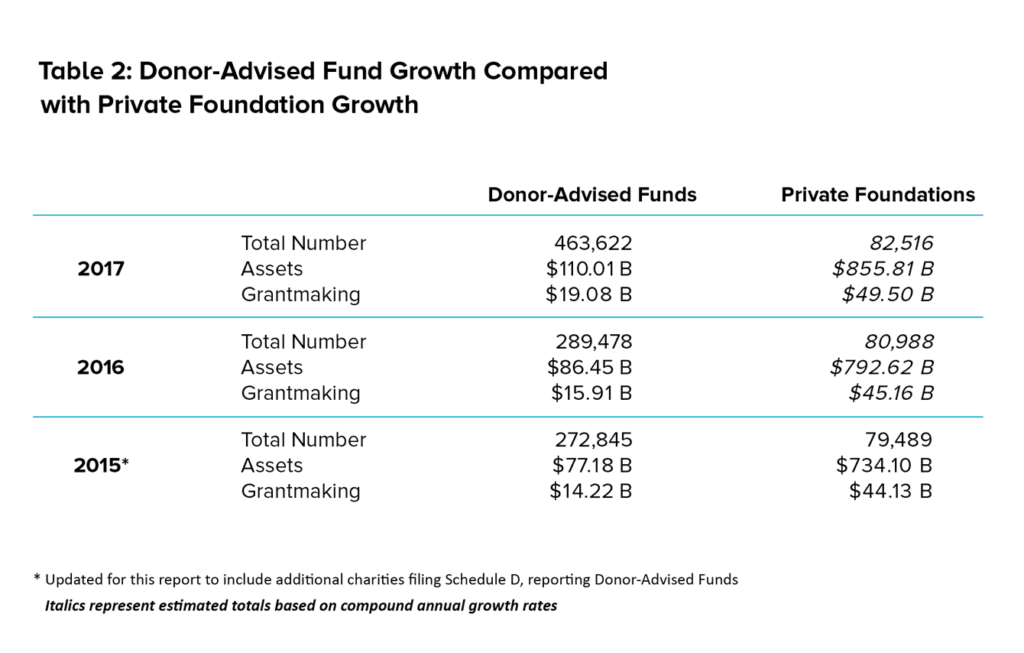
Donor-advised funds have outnumbered private foundations for several years.
Table 2 shows an estimated total of 463,622 donor-advised fund accounts in 2017 among all charitable sponsors included in this report. This number compares with an approximately 80,000 private foundations for the same year.
While there are more than five times the number of donor-advised funds than private foundations, the charitable assets have the opposite relationship. There are $110.01 billion in donor-advised funds and an estimated $855.81 billion in private foundations.
Grants from donor-advised funds to qualified charities totaled $19.08 billion in 2017, equating to roughly 40 percent of the estimated $49.5 billion granted by independent foundations to charities.
Growth in Recent Years
Donor-advised funds grew at a rapid pace in 2017, setting a record in every key metric. The rise in total charitable assets is a result of both an increase in contributions to donor-advised fund accounts and gains from investment returns. Grantmaking from donor-advised funds to qualified charities, which increased by about 20 percent, outpaced contribution growth, which rose by 16.5 percent.
The compound annual growth rate is included for each metric. This measurement calculates a constant rate of return over time (in this case five years) and mitigates volatility. This measurement has been included to provide additional context and a point of comparison for the historical growth. We calculated the compound annual growth rate using all available data.
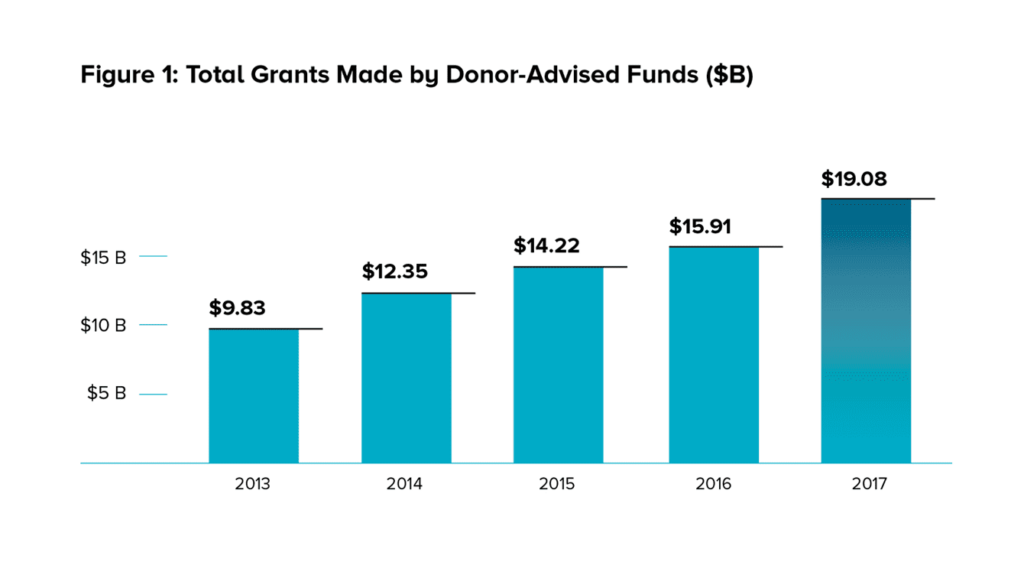
Grants Approach $20 Billion
Grants from donor-advised funds to charitable organizations reached a new high at $19.08 billion. This is a 19.9 percent increase from a revised 2016 total of $15.91 billion. The compound annual growth rate from 2012 to 2016 was 16.9 percent.
Contributions at All-Time High
Contributions to donor-advised funds in 2017 totaled $29.23 billion, also an all-time high. This number surpasses the revised 2016 value of $25.09 billion and shows an increase of 16.5 percent. The compound annual growth rate was 15.7 percent for contributions from 2012 to 2016.
Charitable Assets Pass $110 Billion
Charitable assets under management in all donor-advised funds totaled $110.01 billion in 2017, an all-time high and a 27.3 percent increase from the revised total of $86.45 billion in 2016. The growth can logically be attributed to the 16.5 percent in contributions and investment gains at some donor-advised fund charitable sponsors. The compound annual growth rate for charitable assets from 2012 through 2016 was 17.9 percent.
Number of DAFs Passes 450,000
The number of individual donor-advised funds increased sharply, rising 60.1 percent in 2017 to 463,622. The growth is almost entirely attributable to one new National Charity that opened a donor-advised fund program in 2017. This organization and some other charitable sponsors appear to have many smaller donor-advised funds with an average size of less than $5,000. The compound annual growth rate for number of donor-advised funds from 2012 through 2016 was 9.0 percent.
Grant Payout Remains Above 20%
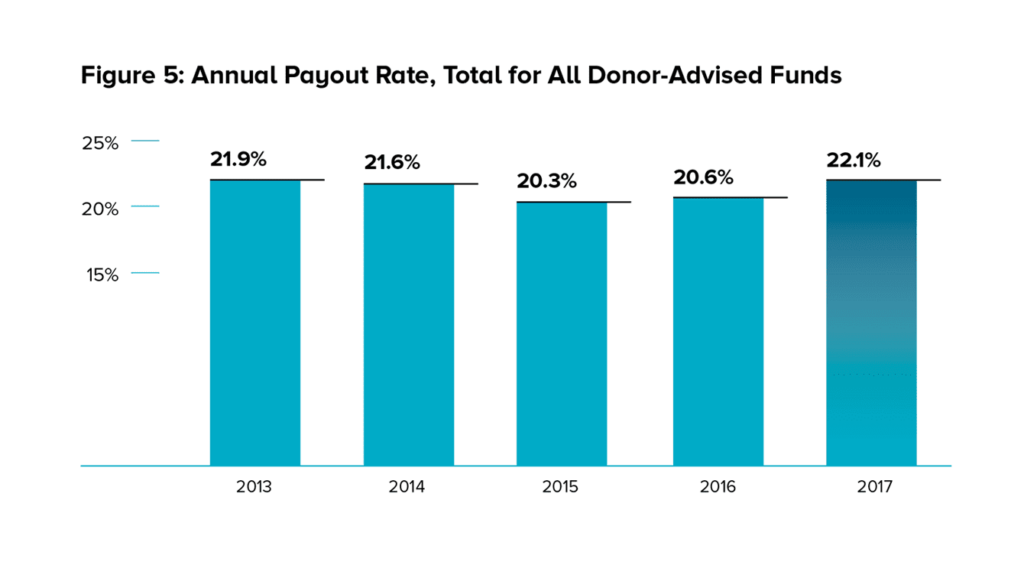
Aggregate grant payout rates from donor-advised funds annually exceed 20 percent for every year on record. The payout rate for 2017 was 22.1 percent. This is above the payout rate of 20.6 percent for 2016.
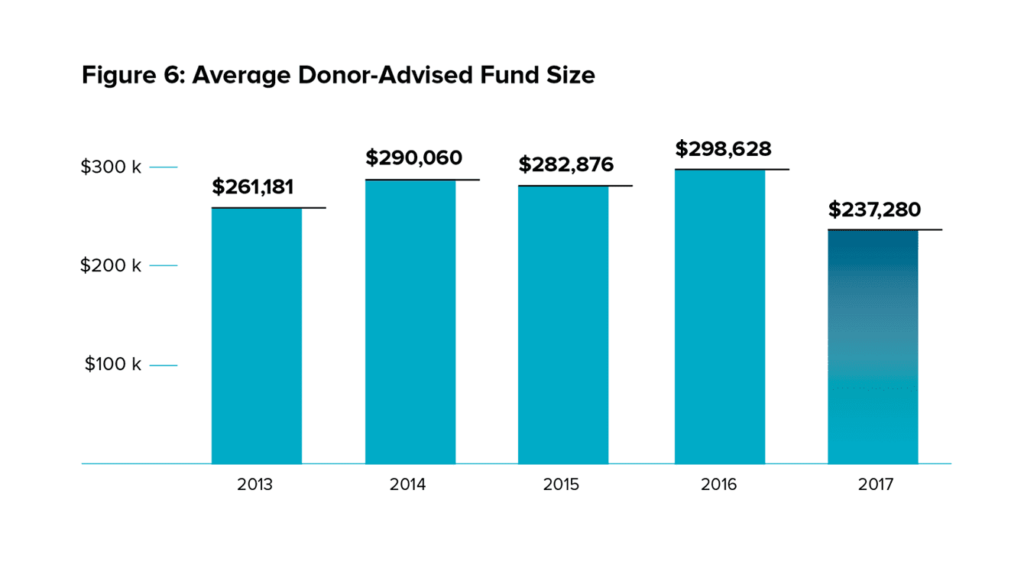
Average Donor-Advised Fund Size Declines
The average size of an individual donor-advised fund is estimated to be $237,280 in 2017. This is a 20.5 percent decrease compared with the revised estimate for 2016 average account size of $298,628. As previously noted, there was growth in the number of individual donor-advised funds with less than $5,000.
Where are Donor-Advised Fund Sponsors?
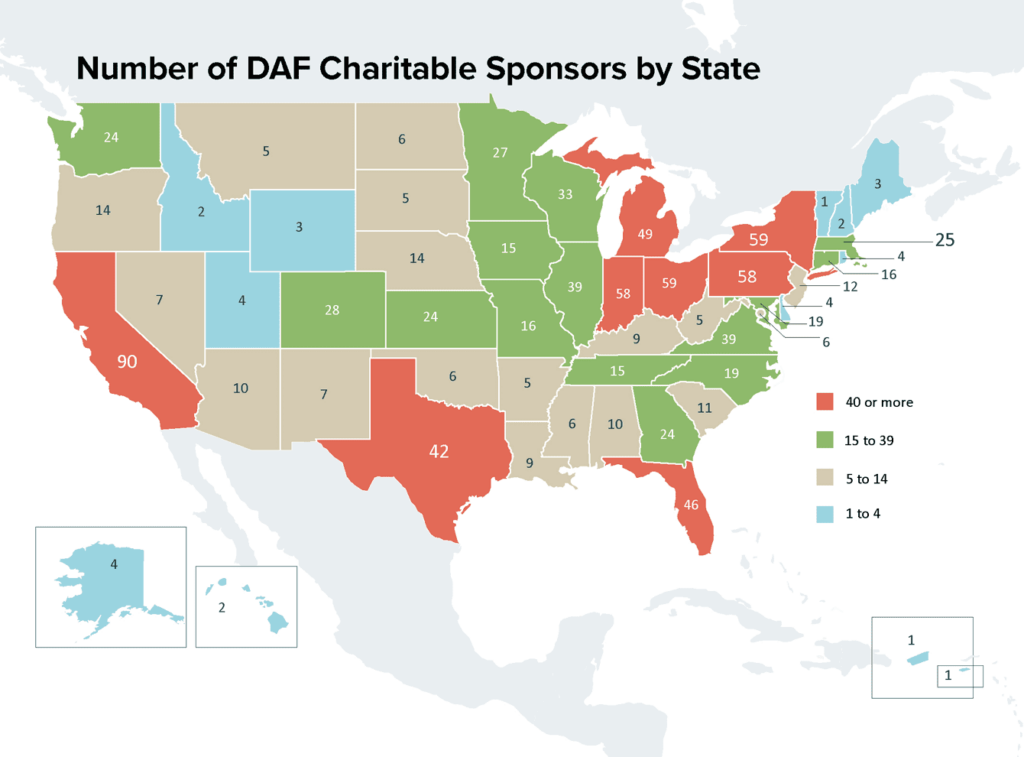
There are donor-advised fund charitable sponsors in every U.S. state, two territories and the District of Columbia. There are five states with more than 50 donor-advised fund charitable sponsors: California (at least 90); New York (at least 59); Ohio (at least 59); Indiana (at least 58) and Pennsylvania (at least 58).
The geographic distribution of donor-advised fund charitable sponsors is very interesting. Surprisingly, several less populated states are home to the highest concentrations of donor-advised fund charitable sponsors. For example, Indiana is the 17th largest state by population, but ranks 4th in number of donor-advised fund charitable sponsors. In this case, the Lilly Endowment began its GIFT Initiative in 1990 to launch and develop Community Foundations across Indiana.[6] There is now a Community Foundation in every county in Indiana. The map shows the number of donor-advised fund sponsors across the U.S.
[6] https://www.inphilanthropy.org/gift
Comparison by Charitable Sponsor Types
There are an estimated 1.3 million registered public charities in the United States.[7] The charities that sponsor donor-advised funds tracked in this report comprise less than 1/10th of one percent of those organizations. In this report, data from three types of donor-advised fund charitable sponsors are reported: National Charities, Community Foundations and Single-Issue Charities.
The first donor-advised funds were opened in the mid-1930s and housed at Community Foundations and Jewish Federations. National donor-advised fund programs emerged in the 1990s.
National Charities’ donor-advised fund accounts outnumber the other two types of charitable sponsors combined. They distribute more grant dollars and have higher aggregate charitable asset values. The average donor-advised fund size at Community Foundations is higher than at the other two types of charitable sponsors. Single-Issue Charity sponsors have the highest grant payout rate of the charitable sponsors analyzed in this study.
National Charities
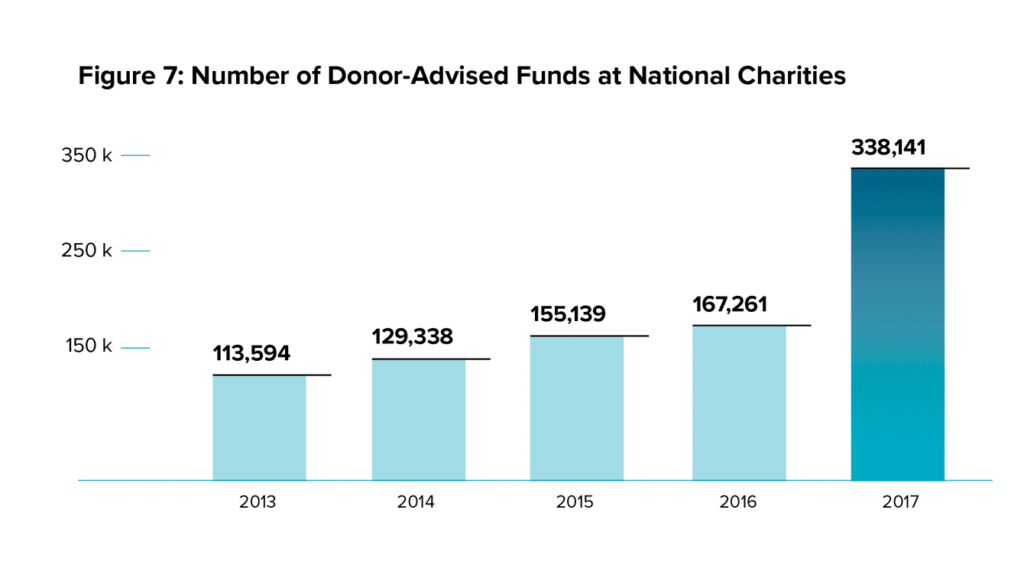
This report analyzes donor-advised fund data from 53 National Charities. These national charitable sponsors had a combined 338,141 donor-advised fund accounts with total charitable assets of $58.58 billion in 2017. The compound annual growth rate is included for each metric. This measurement calculates a constant rate of return over time (in this case five years) and mitigates volatility. This measurement has been included to provide additional context and a point of comparison for the historical growth at National Charities that offer donor-advised funds.
Number of Donor-Advised Funds
The number of individual donor-advised funds at National Charities grew to 338,141 in 2017 from a revised 167,262 in 2016, an increase of 102.2 percent. This doubling resulted from growth at established National Charities plus rapid growth at least four new national donor-advised fund sponsors. These new National Charities offer emerging models of donor-advised fund uses, including workplace giving and employer matching. This one-year growth follows a compound annual growth rate of 12.8 percent from 2012 to 2016.
 Grants
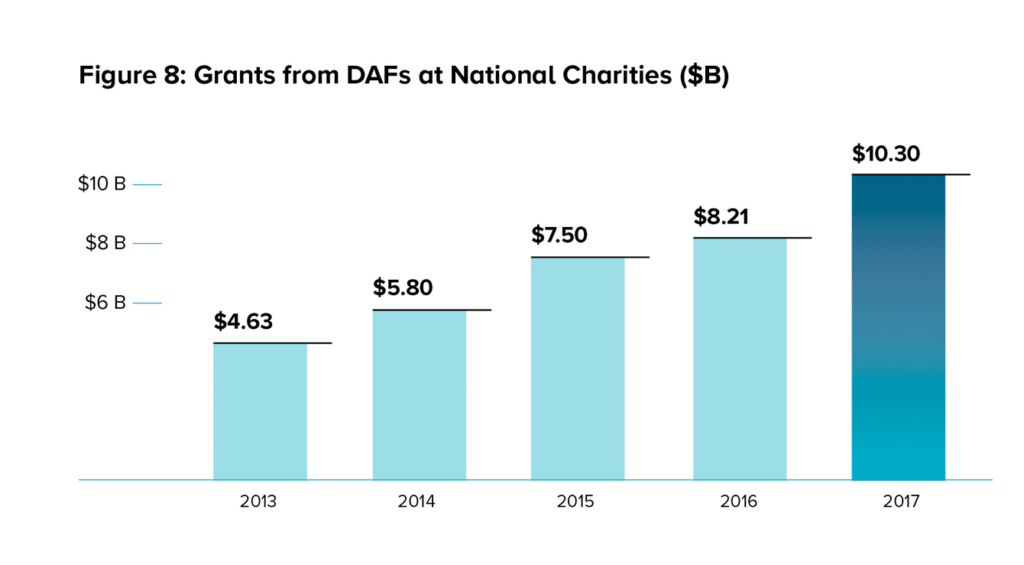
The total value of grants from donor-advised funds at National Charities to other qualified charities totaled $10.30 billion in 2017, an increase of 25.4 percent from 2016. This follows a compound annual growth rate of 21.7 percent from 2012 to 2016.
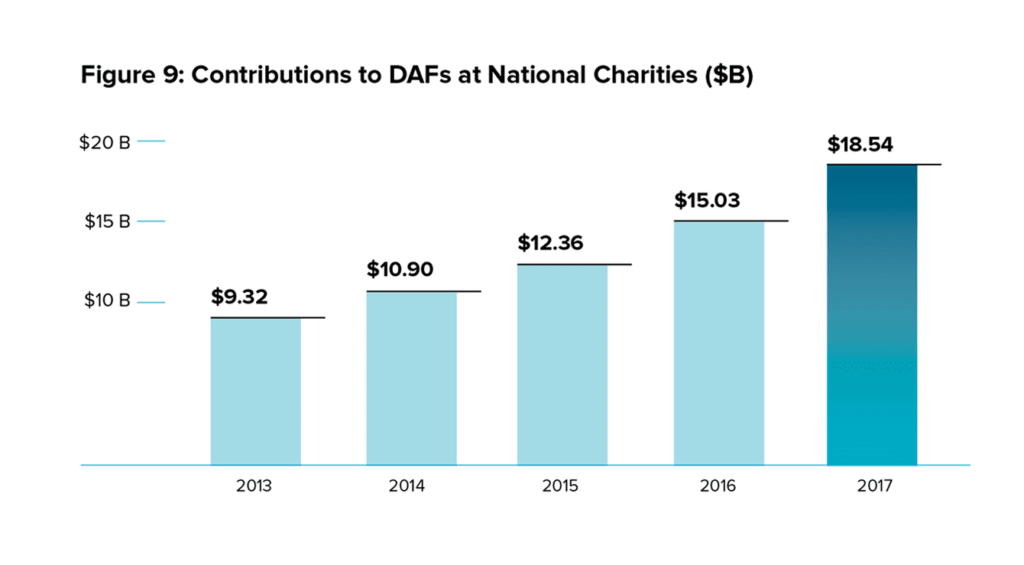
 Contributions
Total contributions to donor-advised fund accounts at National Charities reached $18.54 billion in 2017. This represents a 23.3 percent increase over the prior year. This year’s rate of growth is higher than the compound annual growth rate of 21.2 percent for contributions to National Charities from 2012 through 2016.
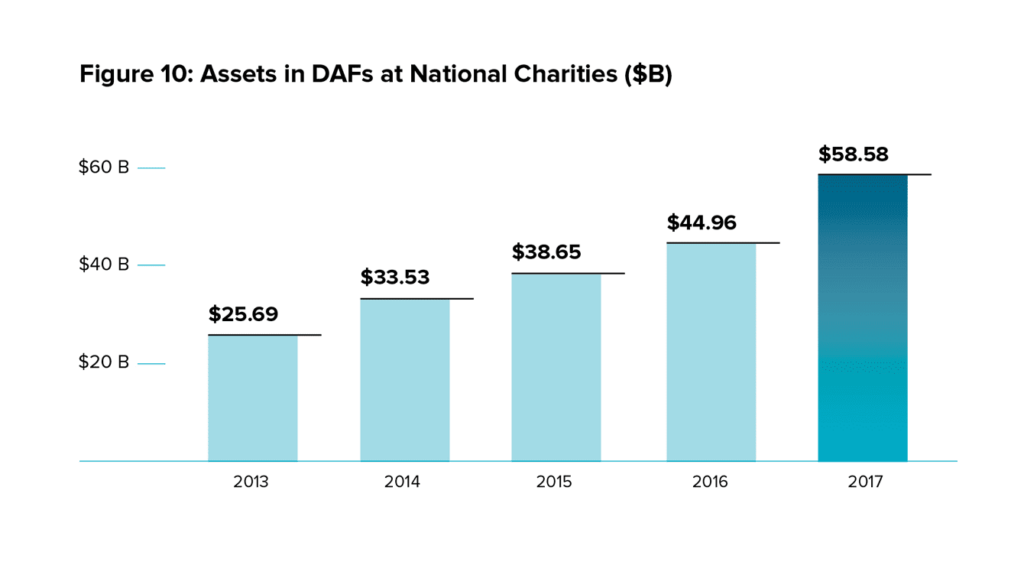
Charitable Assets
From 2016 to 2017, total charitable assets in donor-advised funds at National Charities increased 30.3 percent, from a revised 2016 estimate of $44.96 billion to $58.58 billion for 2017. The compound annual growth rate for charitable assets at National Charities from 2012 through 2016 was 23.9 percent.
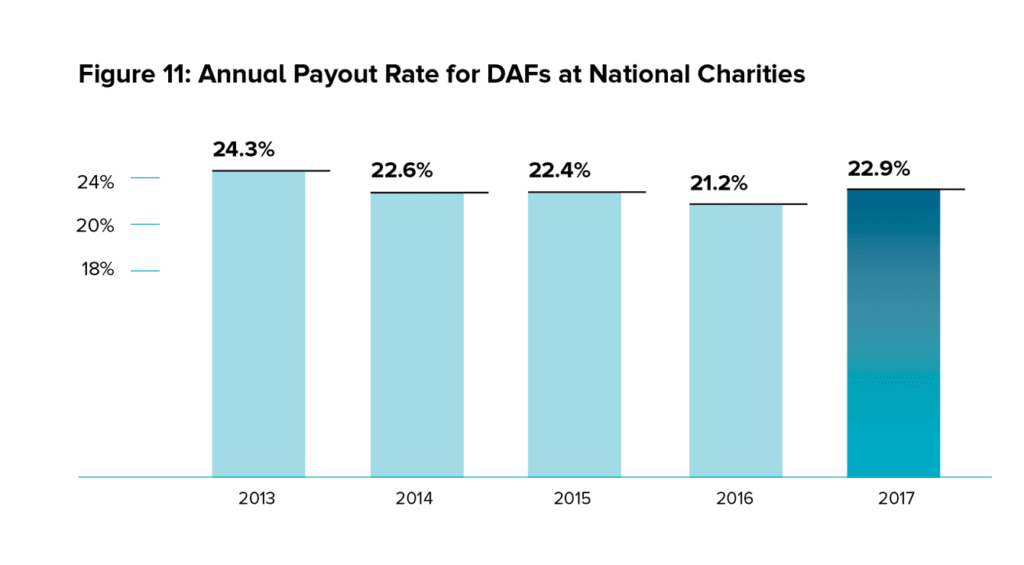
 Grant Payout
The total payout rate from donor-advised funds at National Charities was 22.9 percent in 2017, an increase from a payout rate of 21.2 percent during the prior year.
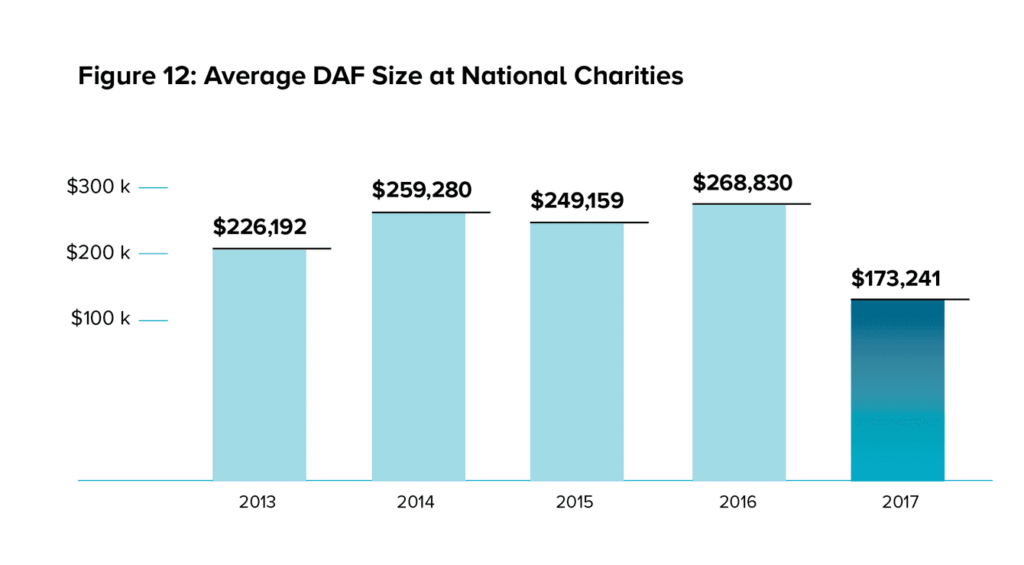
Average DAF Size
The average donor-advised fund size at National Charities in 2017 is estimated at $173,241. This represents a 35.6 percent decline compared with the 2016 average of $268,830. This shift reflects the increase in many smaller donor-advised funds at National Charities, including newer charitable sponsors.
Community Foundations
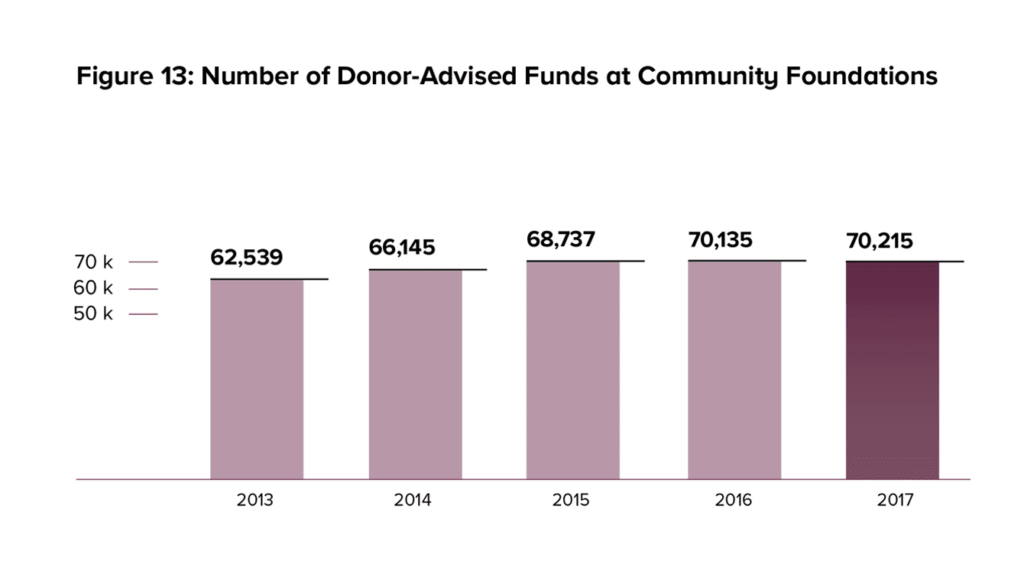
This report analyzes donor-advised fund data from 604 Community Foundations, which have 70,215 donor-advised funds and charitable assets totaling $38.61 billion. The compound annual growth rate is included for each metric. This measurement calculates a constant rate of return over time (in this case five years) and mitigates volatility. This measurement has been included to provide additional context and a point of comparison for the historical growth of donor-advised funds at Community Foundations.
Number of DAFs
The number of individual donor-advised funds at Community Foundations was 70,215 in 2017, an increase of 0.1 percent when compared with 2016. The compound annual growth rate from 2012 through 2016 was 3.9 percent.
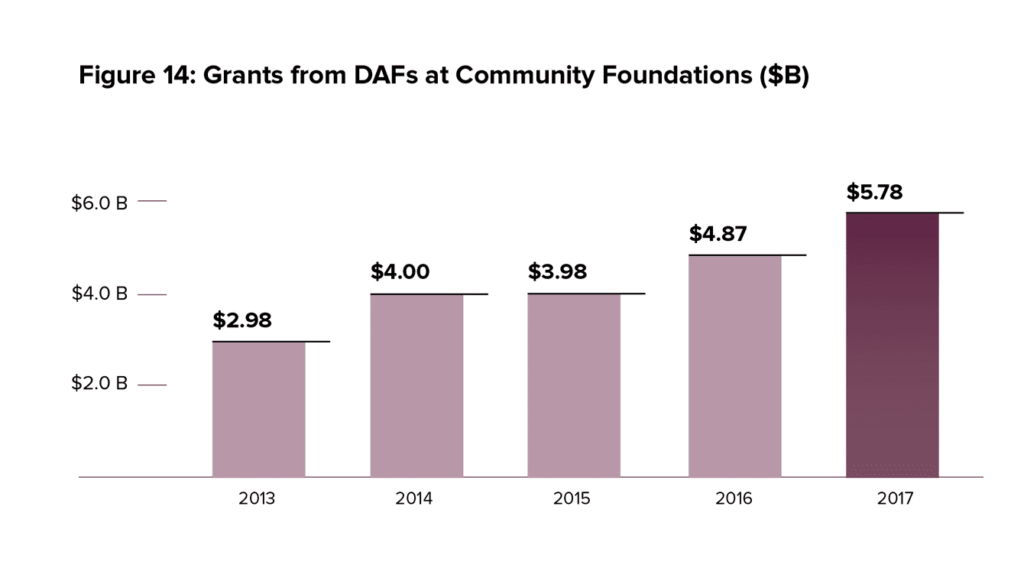
 Grants
Grants from donor-advised funds at Community Foundations totaled $5.78 billion in 2017, up from $4.87 billion granted in 2016—an 18.6 percent increase. The compound annual growth rate from 2012 to 2016 was 16.6 percent.
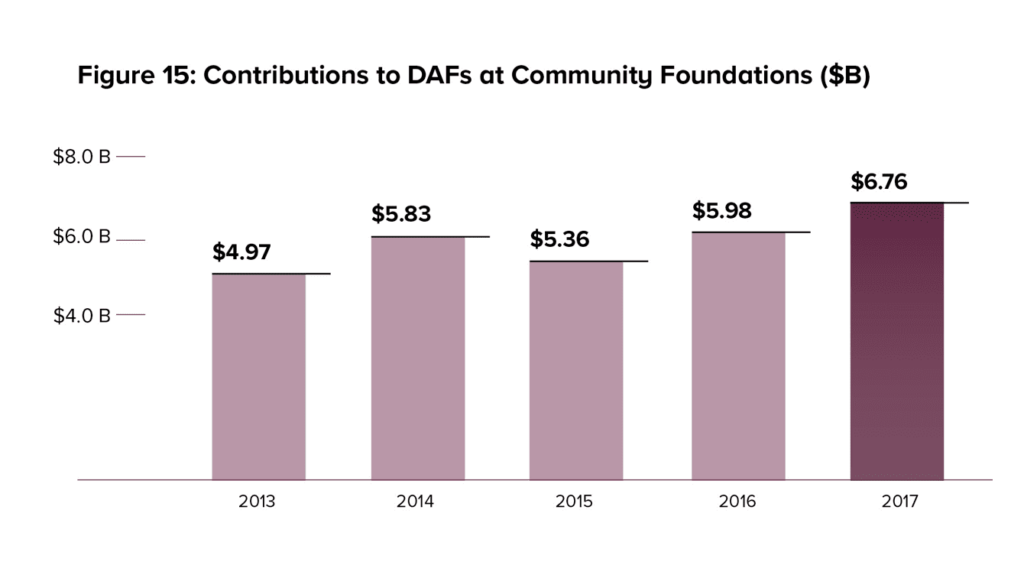
 Contributions
Total contributions to donor-advised funds at Community Foundations were $6.76 billion in 2017, a 13.1 percent increase over the prior year. This is considerably higher than the compound annual growth rate from 2012 to 2016 of 6.9 percent.
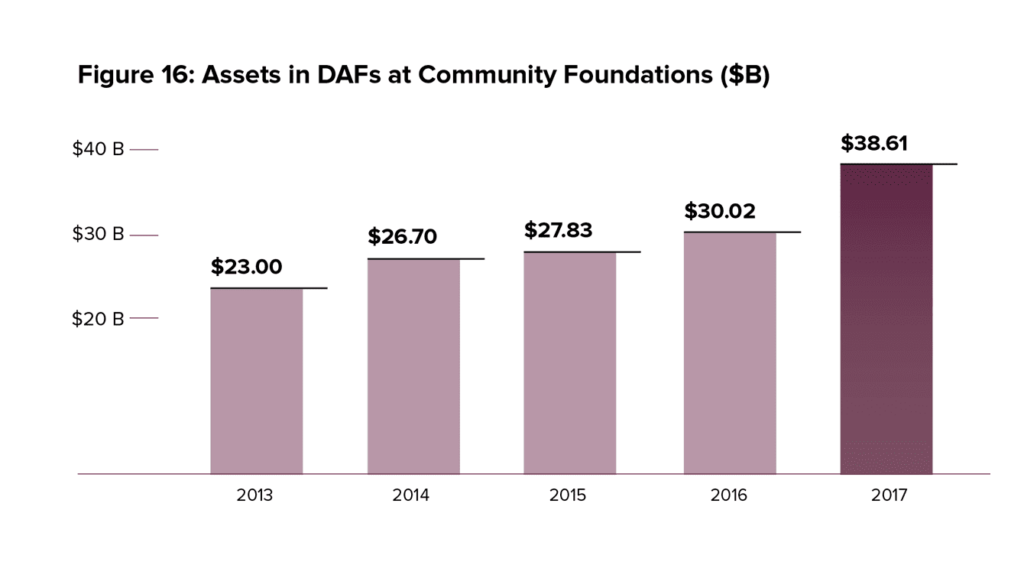
 Charitable Assets
Charitable assets in donor-advised funds at Community Foundations totaled $38.61 billion in 2017, an increase of 28.6 percent from $30.02 billion in 2016. The compound annual growth rate for 2012 through 2016 was 13.1 percent.
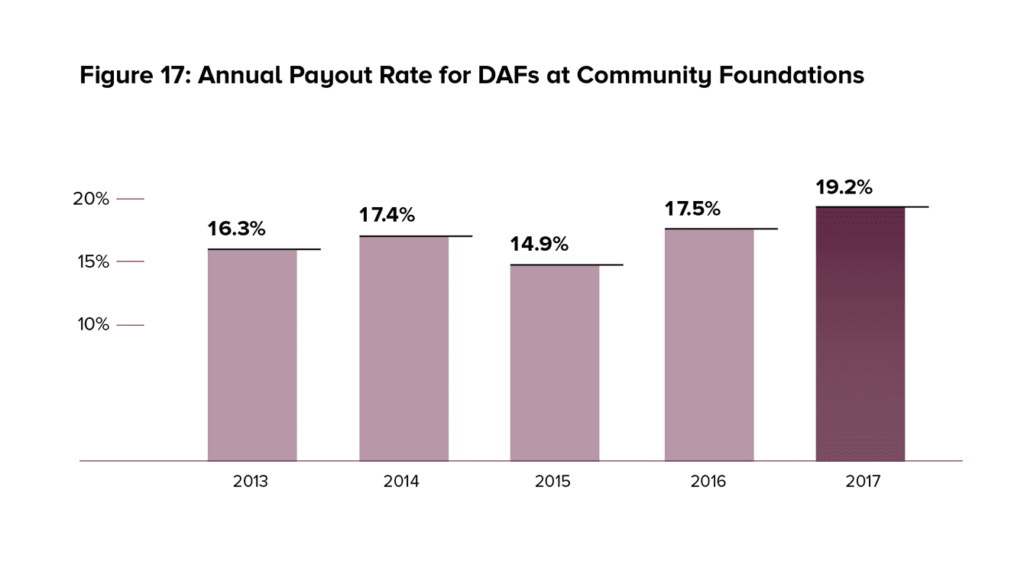
 Grant Payout
The total payout from donor-advised funds at Community Foundations was 19.2 percent in 2017, an increase from 17.5 percent in 2016.
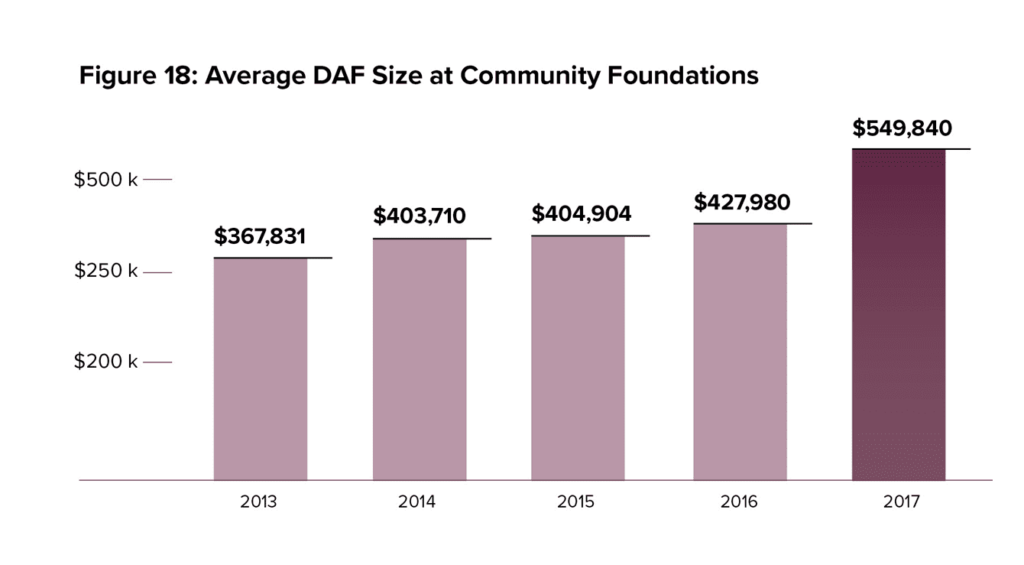
 Average DAF Size
The average account size of donor-advised fund accounts at Community Foundations rose in 2017 to $549,840. This represents a 28.5 percent increase from the 2016 average of $427,980.
Single-Issue Charities
This report analyzes data for 345 Single-Issue Charity sponsors. This type of charitable sponsor held 55,266 donor-advised fund accounts with charitable assets totaling $12.82 billion. The compound annual growth rate is included for each metric. This measurement calculates a constant rate of return over time (in this case five years) and mitigates volatility. This measurement has been included to provide additional context and a point of comparison for the historical growth of donor-advised funds at Single-Issue Charities.
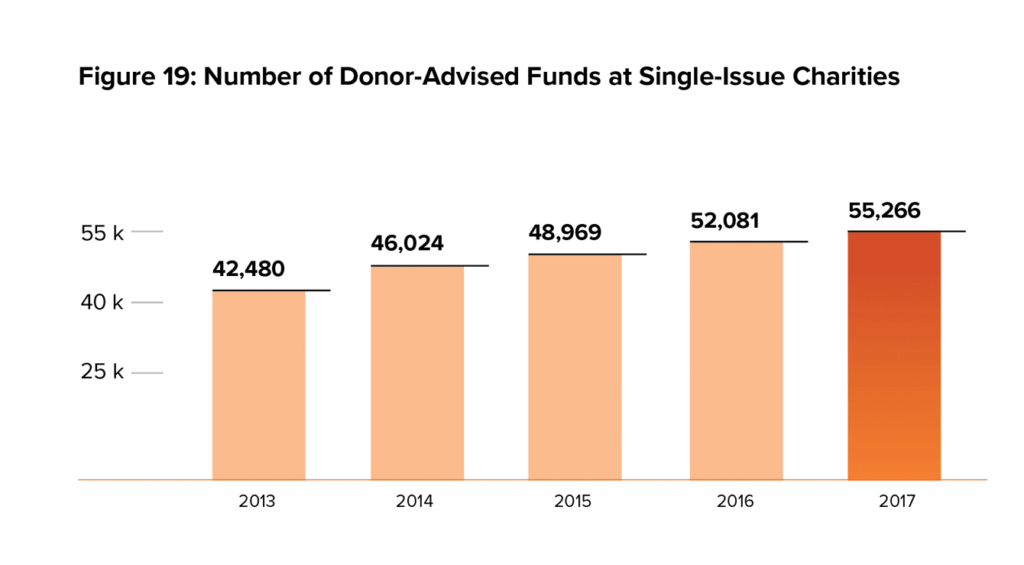
Number of DAFs
The number of individual donor-advised funds at Single-Issue Charities was 55,266. This number is a 6.1 percent increase compared with 2016, when there were 52,082 accounts. The compound annual growth rate from 2012 to 2016 was 6.0 percent.
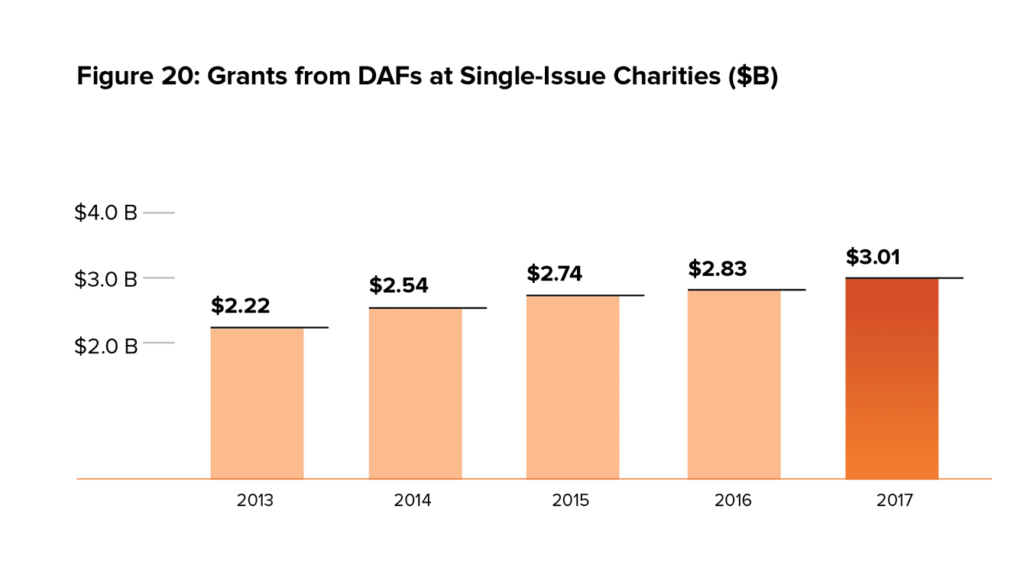
 Grants
Grants from donor-advised funds at Single-Issue Charities totaled $3.01 billion in 2017, up from $2.83 billion in 2016. This is a change of 6.5 percent. The compound annual growth rate from 2012 to 2016 was 7.2 percent.
 Contributions
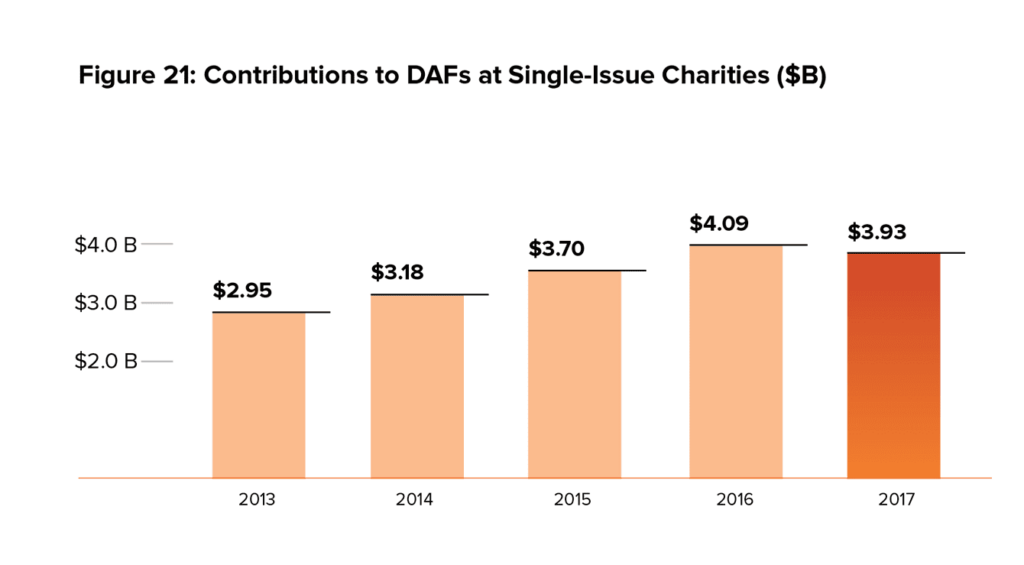
Total contributions to donor-advised funds at Single-Issue Charities dropped from $4.09 billion in 2016 to $3.93 billion in 2017. The change in contributions from 2016 to 2017 represents a decline of 3.8 percent. The compound annual growth rate from 2012 to 2016 was 13.5 percent.
 Charitable Assets
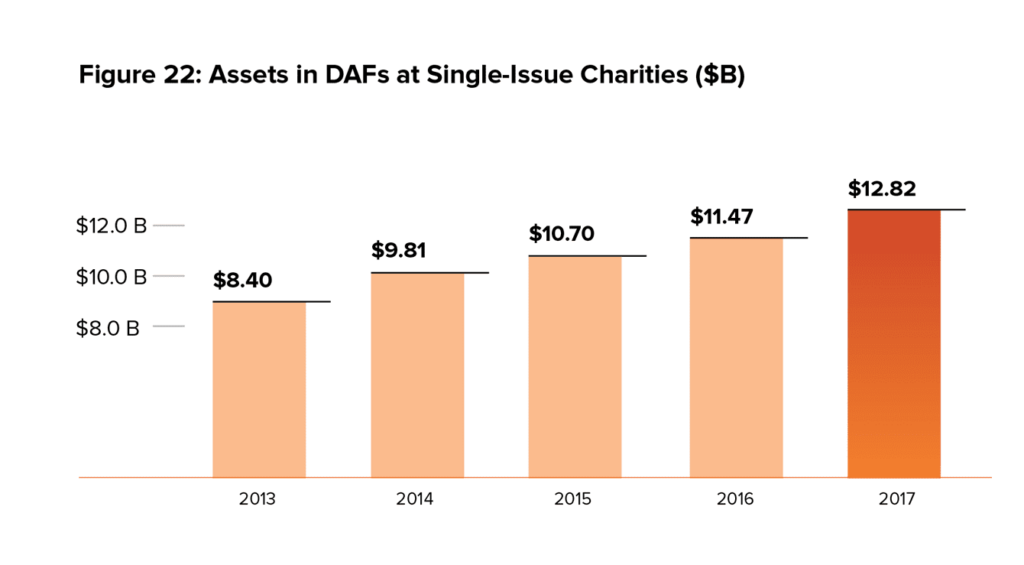
Total charitable assets in donor-advised funds at Single-Issue Charities rose to $12.82 billion, an increase of 11.8 percent, from a revised amount of $11.47 billion in 2016. The compound annual growth rate from 2012 to 2016 was 11.5 percent.
 Grant Payout
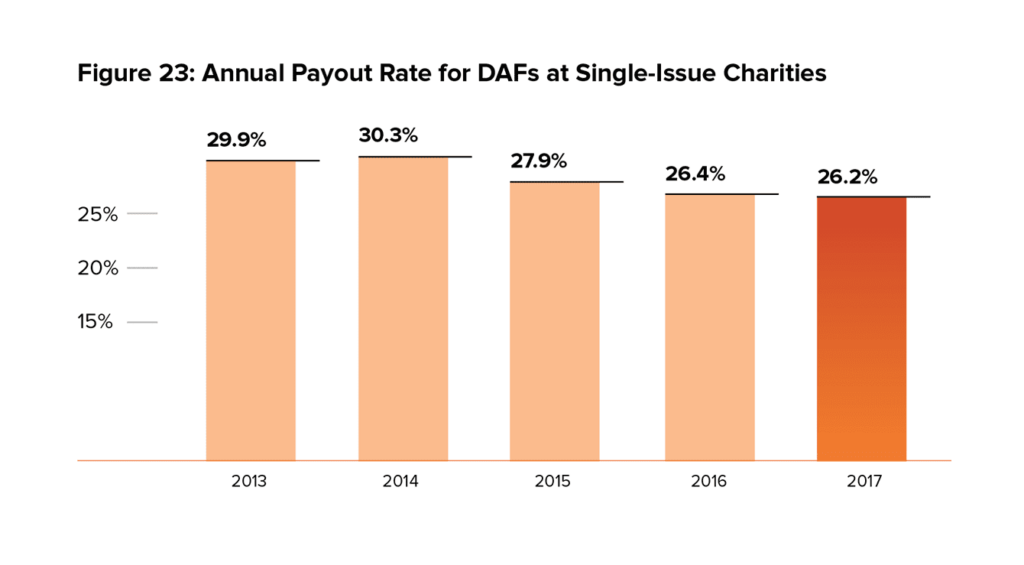
The total payout from donor-advised funds at Single-Issue Charities was 26.2 percent in 2017, nearly the same as the payout rate of 26.4 percent in 2016.
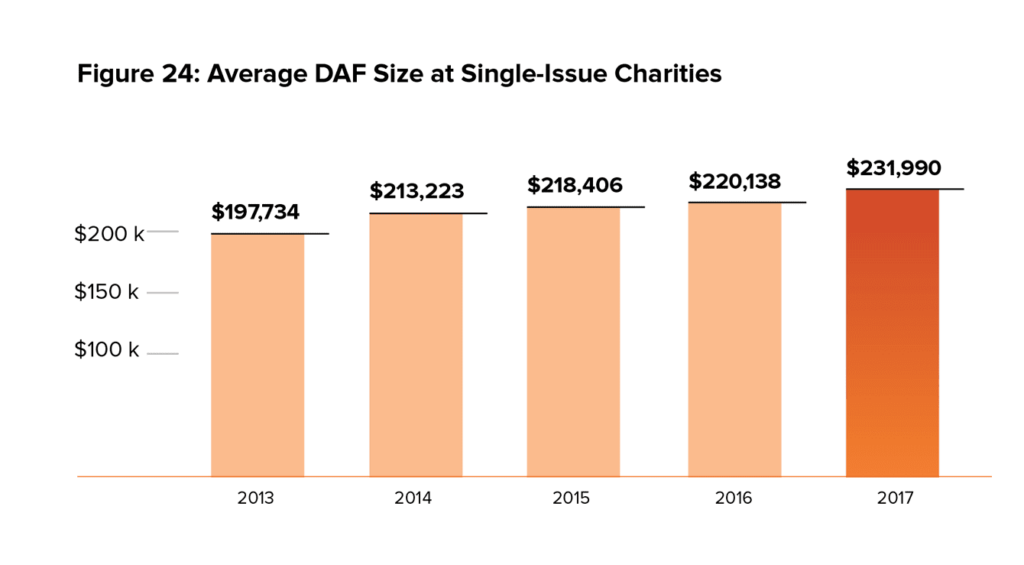
Average DAF size
The average donor-advised fund size at Single-Issue Charities rose in 2017 to $231,990. This represents an increase of 5.4 percent compared with the 2016 average of $220,138.
[7] IRS Data Book, 2017. Table 25: Tax Exempt Organizations, Nonexempt Charitable Trusts, and Nonexempt Split Interest Trusts, Fiscal Year 2017. Line 7. Accessed October 25, 2018. https://www.irs.gov/statistics/tax-exempt-activities
Projections and Results
In last year’s Donor-Advised Fund Report, we predicted that growth in donor-advised fund charitable assets would result in greater grantmaking. This year’s data supports that prediction. Grantmaking increased overall and at each type of charity that sponsors donor-advised funds. As part of our grantmaking prediction last year, we also noted that grants from donor-advised funds at National Charities would continue to rise. We see 25.4 percent growth in National Charities’ grants between 2016 and 2017.
Grantmaking growth has outpaced contribution growth four out of the past five years. The value of grants from donor-advised funds in 2017 ($19.08 billion) equates to 65 percent of contributions to them ($29.23 billion) in the same time period.
In our last report, we also predicted contributions to donor-advised fund would continue to rise at a slower rate. This proved true at National Charities, where contributions increased 23.3 percent in 2017 after rising 21.7 percent in 2016. Community Foundations saw a growth of 6.0 percent in contributions in 2017, compared with an increase of 11.5 percent in 2016. For 2017, however, contributions declined by 12.7 percent at Single-Issue Charities, after an increase of 10.1 percent in 2016. This shift was widespread at Single-Issue Charities, as giving to donor-advised funds declined at a more than half of the sponsoring charities for which we have data for 2017.
In the last several years, we have written about political or economic anomalies that created a “new normal” for donor-advised fund giving—from the first “Fiscal Cliff” in 2012 to speculation about the impact of the 2016 U.S. presidential election. The Tax Cuts and Jobs Act of 2017, which was passed by Congress in December 2017, is another event that impacts charitable giving. The bill doubled the standard tax deduction for single and joint tax filers, effectively eliminating the need for 66 percent of Americans to itemize deductions.
The new tax laws went into effect on January 1, 2018, driving some donors to give more charitably at the end of the 2017 calendar year. Donor-advised funds offer donors an immediate tax deduction and the ability to support their favorite charities over time—an attractive option for those who wanted to “pre-fund” their giving while the tax deduction was more valuable and could be counted.
What Lies Ahead?
This report captured some of charitable activity at the end of the calendar year. The full impact will be reflected in next year’s Donor-Advised Fund Report as charities report their data to the IRS based on their fiscal year, not the calendar year. Some of the nation’s largest donor-advised fund charitable sponsors, including National Philanthropic Trust, have yet to report their activity from this time period as they are on a July-June fiscal year. As such, we anticipate continued growth in contributions, particularly at National Charities.
With the increase in contributions and assets for 2017, we predict a continued increase in grantmaking and a possible increase in payout rates. Grants grew by 19.9 percent between 2016 and 2017, compared with a compound annual growth rate of 16.9 over from 2012 through 2016. Grantmaking from donor-advised funds continues to reflect payout rates above 20 percent at all sponsor types.
We are also beginning to collect data about the type of assets donors contribute to donor-advised funds. We have analyzed a limited data set that represents 61.5 percent of contributions to donor-advised funds in 2016. Of those contributions, approximately 60 percent were non-cash assets. The vast majority were publicly traded securities. The data also shows that donors contribute other assets to their donor-advised funds, such as closely held stock, real estate and personal property. For example, in our data set, contributions of LLC partnership interests increased from 4 percent of all non-cash contributions in 2012 to 6 percent in 2017. We anticipate that donors will increasingly contribute non-cash assets to their donor-advised funds in the coming years.
Our projections are based on NPT’s experience and observations over the past year and on empirical data we have collected.
Summary
Donor-advised funds continued their upward trajectory of growth with all key metrics rising. Grantmaking increased by almost 20 percent. Aggregate payout rates have been near or above 20 percent since we first started collecting data in 2007. This suggests that donors who use this type of charitable giving vehicle are supporting philanthropic organizations and the public good with a consistent level of grantmaking.
Methodology
This edition of the Donor-Advised Fund Report examined a total of 1,002 charities registered under Section 501(c)(3) of the Internal Revenue Code that sponsor and/or manage donor-advised funds. These include the following organizations:
- National Charities: organizations that are independent or are commercially affiliated and national in reach; not focused on a particular region; do not have a specific religious and/or focus area. Examples include National Philanthropic Trust, Fidelity Charitable Gift Fund and Renaissance Charitable Foundation.
- Community Foundations: organizations that have a specific geographic or regional focus. Examples include Cleveland Foundation, Delaware Community Foundation and Community Foundation of the Ozarks.
- Single-Issue Charities: organizations that support a specific religious faith; focus on a particular issue area or cause; or fund a specific institution. Examples include Jewish Federation of Rhode Island, San Diego Human Dignity Foundation and Stanford University.
Primary Data Source
The primary source for each charitable sponsor’s assets, contributions, grants and total number of donor-advised funds is their IRS Form 990. The Form 990 is the annual information return that charities file with the Internal Revenue Service. For those organizations that filed returns for FY2009 and later, this information is found in Schedule D. For organizations that filed returns prior to FY2008, this may include information found on Schedule D.
NPT obtained copies of Form 990 via GuideStar. In select cases, NPT obtained copies of Form 990 from the Foundation Center’s 990 Finder or the organization’s website.
Since organizations have varied fiscal years, which may end March 31, June 30 or December 31, data was recorded in the fiscal year in which the charity filed the 990 Form with the IRS and posted on GuideStar. For example, whether an organization’s fiscal year ends on March 31, 2017 or December 31, 2017, the data will be recorded as 2017. This is consistent with GuideStar’s reporting process in date stamping all Form 990s for the organizations’ respective fiscal years.
Continuous Data Updates
Starting in the 2014 edition of the Donor-Advised Fund Report, National Philanthropic Trust compiled a larger file covering more donor-advised fund sponsors. In this edition, the data are again compiled from that larger file. In addition, the review of data from GuideStar showed some charities with donor-advised funds that had not previously been included. The data collection process included obtaining IRS Forms 990 back to 2007 for any entity added to the donor-advised fund data set.
For this 2018 edition, NPT reviewed 1002 organizations that reported at least $1 in assets from fiscal year 2013 through fiscal year 2017: 53 National Charities, 604 Community Foundations and 345 Single-Issue Charities. For this edition, NPT used the most recent data from IRS Forms 990. For some organizations whose fiscal year 2017 data was not yet publicly available, we received the data directly from the charity.
NPT maintains a time series of all key data points (charitable assets, grants, contributions and accounts) back to FY2007. Some of the organizations in the historical file have closed or merged.
Payout Calculation
Payout from donor-advised funds is calculated to resemble how the Foundation Center estimates the grant payout rate for private foundations.
The Foundation Center published a report about how payout rate is determined using rules established in the tax code. The tax code allows private foundations to include as “qualified distributions” certain expenses associated with grantmaking and other payments made for charitable purposes (e.g., conferences, technical assistance for grantees and other expenses). Those expenses are too complex to track accurately for 75,000+ private foundations. In its work, the Foundation Center uses a simpler approach, which this report now replicates.
In the Foundation Center method, the current year’s grants are divided by investable assets held at the end of the prior year. When using this method, the payout rates for donor-advised funds rise from prior levels reported in the Donor-Advised Fund Reports before 2015.
For a comparison of the impact of using the Foundation Center method, see Figure 13 in the 2015 Donor-Advised Fund Report.
Acknowledgements
This report was prepared by National Philanthropic Trust under the guidance of Eileen R. Heisman, President and CEO; Andrew W. Hastings, Chief Development Officer; Erin H. Hoyes, Senior Director of Communications; and NPT’s Marketing and Communications Department. Melissa S. Brown of Melissa S. Brown Associates, LLC provided analysis and additional writing services. Fiona Kennedy and Sumner Sykes provided research assistance. We also thank Danielle Vance-McMullen of the University of Memphis for her counsel.
NPT gratefully acknowledges all the organizations that shared their donor-advised fund statistics and information. For permission to cite or reproduce this report, please contact Erin Hoyes, NPT’s Senior Director of Communications, at ehoyes@nptrust.org or 215.277.3043.
Downloads
Current DAF Report
Archived DAF Reports