The 2020 DAF Report is Coming Soon
For questions or to be included in the publication notification, please email, Media: Virgilio Media All Other Inquiries: NPT Communications Team.
NPT is proud to publish our 13th annual Donor-Advised Fund Report.
Our 2019 Donor-Advised Fund Report examines 2014 through 2018 fiscal year data from 989 charities. For the ninth consecutive year, there was growth in all key metrics—number of individual donor-advised funds, total grant dollars from donor-advised funds to charitable organizations, total contributions to donor-advised funds and total charitable assets in them.
Over the past decade, donor-advised funds have experienced tremendous growth. The growth rate has compounded in recent years. Most notably, grantmaking from donor-advised funds to qualified charities has nearly doubled in the past five years. In 2018, philanthropists recommended grants to charities from their donor-advised funds totaling $23.42 billion. The same rapid growth also applies to contributions to donor-advised funds, which totaled $37.12 billion in 2018. This represents an 86 percent increase in contributions over the past five years.
The biggest rate of change is occurring in the number of individual donor-advised fund accounts. For the second year in a row, there was growth above 50 percent in the number of new donor-advised fund accounts. This growth has been driven in large part by a few new donor-advised fund sponsors that are using donor-advised funds in flexible ways, such as facilitating employee giving. These emerging models for donor-advised funds typically have no minimums, stay in cash and make smaller grants to charities. More traditional donor-advised fund models often support lifetime and legacy giving with investment options that can support multi-generational giving.
What I’ve observed in my long career in charitable giving is what every fundraiser and many philanthropists know: Donor-advised funds can be used in so many ways, by different generations, and on all time horizons. Donors today want to stay close to their giving and they want it to be easy. Donor-advised funds help achieve both, which is why they are such a popular giving tool. As new models for using donor-advised funds emerge, the growth in their use reflects the importance of charitable giving to the American people of all ages and interests.
Regards,
Eileen R. Heisman
President & CEO
About this Report
Donor-advised funds are one type of charitable giving vehicle that enables donors to reach their philanthropic goals. The rapidly increasing number of individual donor-advised fund accounts make them the fastest-growing vehicle in philanthropy, and the rising value of charitable dollars granted from donor-advised funds also makes them the most active philanthropic vehicle. National Philanthropic Trust provides this report as a public service to those who are interested in this important charitable giving vehicle.
National Philanthropic Trust began tracking donor-advised fund data in 2007. Since that time, we have analyzed 61 National Charities, 623 Community Foundations and 391 Single-Issue Charities for a total of 1,075 sponsors. The 2019 Donor-Advised Fund Report relies on data from 989 charitable sponsors that reported assets in any year from 2014 through 2018.
We perform regular audits of our database of donor-advised fund charitable sponsors, adding new charitable sponsors and removing closed ones each year. We also compare our database against all charities that complete the IRS 990 Form Schedule D, which specifically relates to donor-advised funds. We study and verify the accuracy of the filings before adding the organization to our database.
Charitable Sponsors Examined in this Report
54
national charities
603
community foundations
332
single-issue charities
Purpose and Scope
This report provides an up-to-date analysis of donor-advised funds. It is based on data collected during the second and third quarters of 2019 about donor-advised funds and the charities that operated them in fiscal year 2018. This report analyzes data from 989 charitable sponsors. Additional data came from audited financial statements, annual reports, organizational websites and news releases.
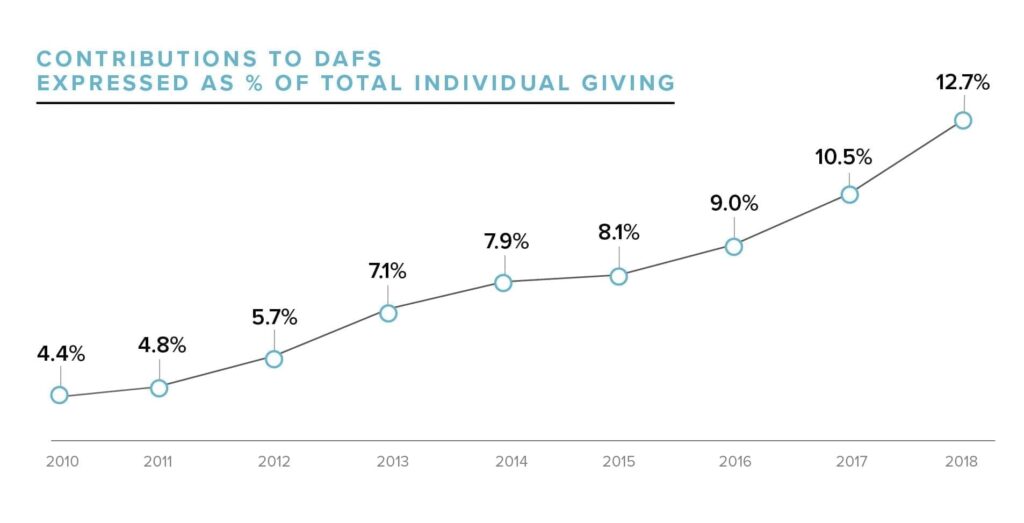
Total estimated charitable contributions in the United States in 2018 were $427.71 billion, according to Giving USA. Individual giving accounted for $292.09 billion, or 68 percent of all charitable giving in the U.S., in 2018. Contributions to donor-advised funds have increased as share of total giving over the past decade. For 2018, donors contributed an estimated $37.12 billion, or the equivalent of 12.7 percent of individual giving. This is a continued increase compared with 2017, when contributions to donor-advised funds were the equivalent of 10.5 percent of individual giving.
Note: Individual giving estimates are from Giving USA 2019. All values reflect the most current data available from Giving USA 2019 and from National Philanthropic Trust’s collected data on donor-advised fund contributions based on IRS Forms 990 and estimates. We recognize that donor-advised fund contributions are not entirely from individuals. Using individual giving consistently as the denominator provides a continuous point of comparison.
Glossary of Terms
Charitable Assets
The dollar amount charitable sponsors hold and manage in donor-advised funds. Some charitable sponsors manage other types of funds as well. This report is limited to assets in donor-advised funds.
Charitable Organization
A tax-exempt organization registered with the IRS and recognized under Section 501(c)(3) of the Internal Revenue Code. Donations to a charitable organization are tax-deductible to the donor, when the donor claims deductions on income taxes. A charitable organization serves broad public purposes in educational, religious, scientific and artistic fields, among others, as well as the relief of poverty and other public benefit activities. In the context of this report, a charitable organization can be either a charitable sponsor of donor-advised funds or the recipient of a donor-advised fund grant.
Charitable Sponsor
A tax-exempt charitable organization that manages donor-advised funds. Charitable sponsors provide services to ensure that potential grant recipients are qualified charitable organizations and administer donor-advised funds to ensure compliance with all regulations. Also called sponsoring charity or fund sponsor.
Community Foundation
A tax-exempt organization that raises funds from the public. Most Community Foundations, both trust and corporate forms, qualify as publicly supported charities under IRC 509(a)(1) and 170(b)(1)(A)(vi). It is a philanthropic institution with a long-term goal of engaging many separate donors to carry out charitable interests for the benefit of residents of a defined geographic area, typically no larger than a state.
Compound Annual Growth Rate
The compound annual growth rate is a useful measure of growth over multiple time periods. It can be thought of as the growth rate that gets you from the initial value to the ending value if you assume that the value has been compounding over the time period.
Contribution
Amount a donor gives to a donor-advised fund when establishing the fund or adding money to it.
Donor-Advised Fund
A philanthropic giving vehicle administered by a charitable sponsor. A donor-advised fund allows donors to establish and fund the account by making irrevocable, tax-deductible contributions to the charitable sponsor. Donors then recommend grants from those funds to other charitable organizations.
Grant
A transfer of assets from a donor-advised fund to a qualified charitable recipient.
Grant Payout
The percentage of total charitable assets at the end of one year that any one type of charitable sponsor or all charitable sponsors grants from a donor-advised fund to qualified charities and charitable projects. Grant payout in this report is calculated as grants made in the current year divided by donor-advised fund assets held at the end of the prior year.
National Charity
A tax-exempt organization with a national focus in fundraising and grantmaking. National Charities include independent organizations, such as National Philanthropic Trust, and other charitable organizations affiliated with financial institutions.
Private Foundation
A tax-exempt organization recognized under Section 501(c)(3) of the Internal Revenue Code formed and controlled by a donor or small group of donors for the purpose of distributing money to charitable organizations or individuals. In this report, corporate foundations are not included in the definition.
Single-Issue Charities
A tax-exempt organization that works in a specific topic area. Some common Single-Issue Charities include universities, Jewish federations, other faith-based charities and issue-specific charities, such as those in the environmental, social justice or international relief arenas.
Market Overview
The period we analyze in this report is fiscal year 2018. Charities operate on different fiscal year periods, which means the reporting period began as early as July 1, 2017 for some charities and ended as late as December 31, 2018 for others. This particular 18-month period was marked by a very volatile stock market. As a result, the data in this report cover two different economic conditions: growing market and retracting financial market. During this time there were also important social, political and environmental events that contributed to the charitable climate, including U.S. midterm elections; border security debates; wildfires in California; mass shootings at schools and places of worship; and several global humanitarian crises.
Economic indicators play an important role in charitable giving throughout the year, but they did not move in synchrony in 2018. The Standard & Poor’s 500 (S&P Index) fell by more than 165 points from the end of 2017 to the end of 2018.[1] The total U.S. economy, as measured by real (inflation-adjusted) Gross Domestic Product, grew by 2.9 percent for calendar year 2018,[2] up slightly from growth of 2.4 percent in 2017 (also adjusted for inflation).[3] The official unemployment rate fell further in 2018 to 3.9 percent, down from 4.1 percent the prior year.[4] Personal income, also adjusted for inflation, rose by 3.4 percent.[5]
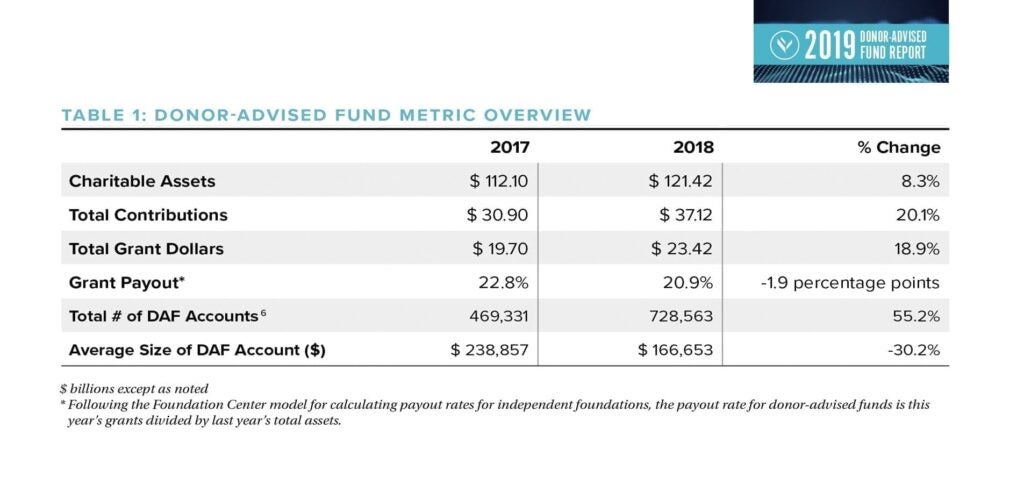
In 2018, donor-advised funds saw continued growth in all key metrics, including grant dollars, contributions, charitable assets and number of donor-advised funds. (Table 1)
Of Note:
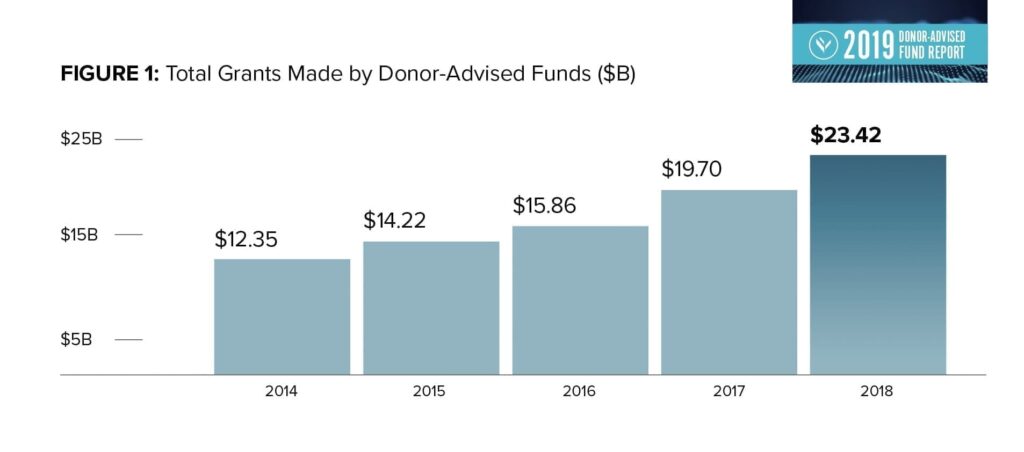
- Grants from donor-advised funds to qualified charities totaled an estimated $23.42 billion, representing an increase of 18.9 percent compared to 2017, which is revised to $19.70 billion. The compound annual growth rate (CAGR) from 2014 through 2018 was 17.4 percent.
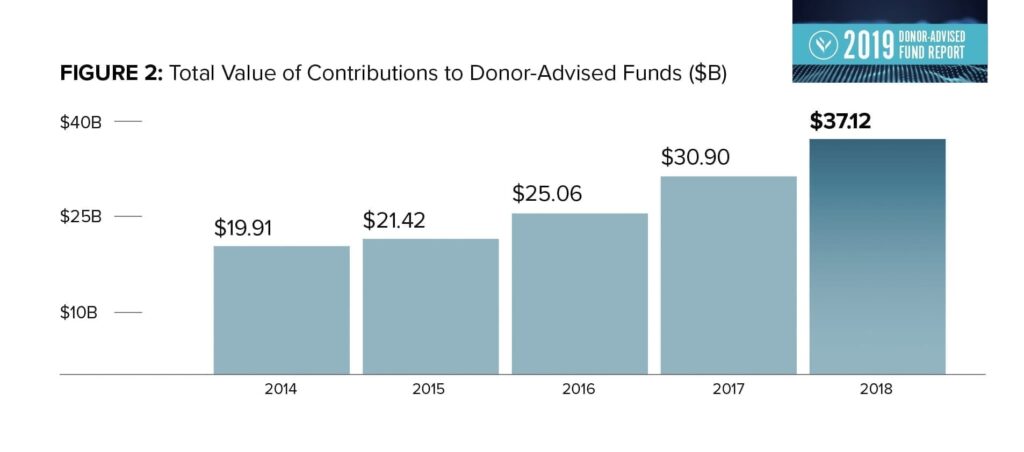
- Contributions to donor-advised funds increased by 20.1 percent to $37.12 billion, compared to the prior year’s revised contribution total of $30.90 billion. The compound annual growth rate from 2014 through 2018 for contributions was 16.9 percent.
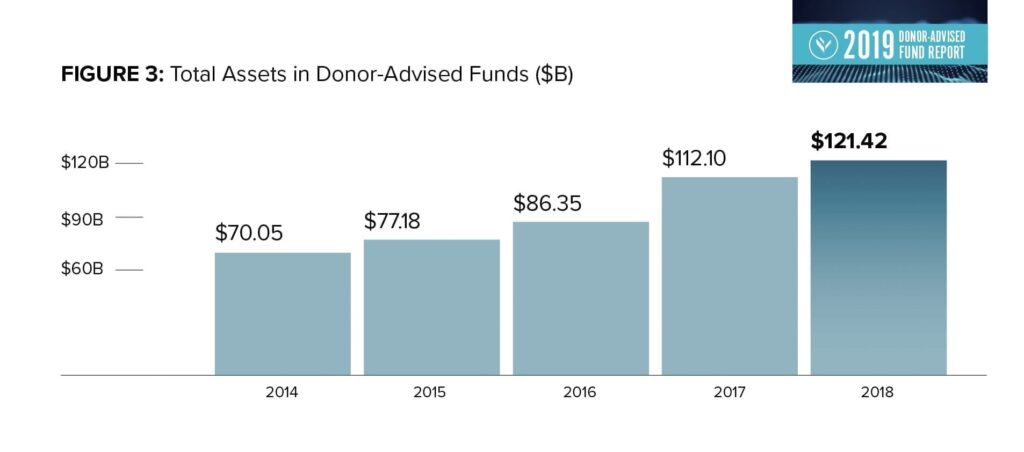
- Charitable assets in donor-advised funds grew from $112.10 billion in 2017 to $121.42 billion in 2018, an 8.3 percent increase. From 2014 through 2018, charitable assets rose by a compound annual growth rate of 14.7 percent. Growth includes contributions and investment yield less assets distributed in grants.
Comparison to Private Foundations
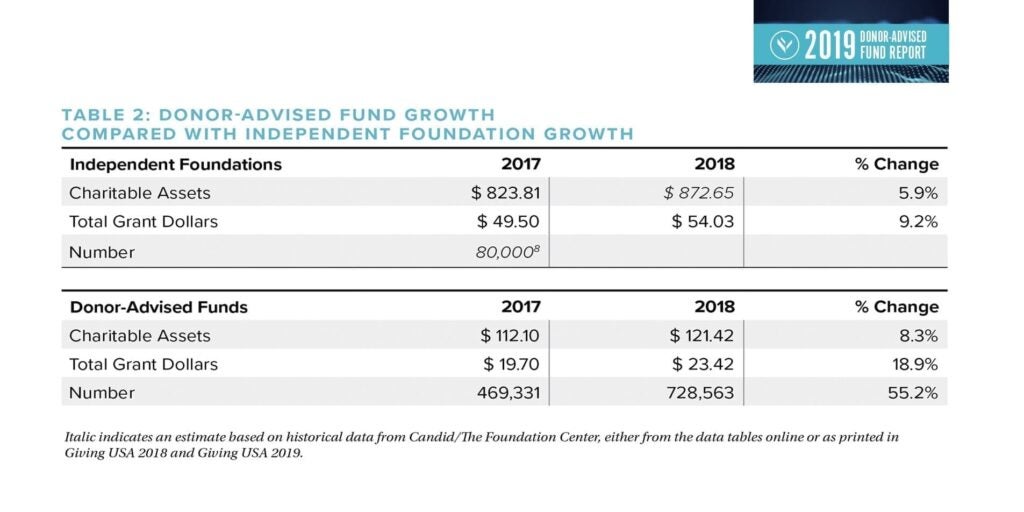
Table 2 shows an estimated total of 728,563 donor-advised fund accounts in 2018 among all charitable sponsors included in this report. This number compares with approximately 80,000 independent (non-corporate) foundations in recent years.
While there are approximately nine times the number of donor-advised funds as private foundations, the charitable assets have the opposite relationship. There are an estimated $121.42 billion in donor-advised funds and an estimated $872.65 billion in private foundations.[7]
Grants from donor-advised funds to qualified charities totaled $23.42 billion in 2018, equating to just over 43 percent of the estimated $54.03 billion granted by independent foundations to charities.
[1] Standard & Poor’s 500 Index, December 29, 2017 and December 31, 2018. Obtained October 3, 2019 from https://ycharts.com/indicators/sp_500.
[2] Real Gross Domestic Product, 2017 and 2018. Obtained October 3, 2019 from National Income & Product Table 1.1.6, https://www.bea.gov/data/gdp/gross-domestic-product.
[3] Ibid.
[4] Unemployment rate, Labor Force Statistics from the Current Population Survey, 2017 and 2018. Obtained October 3, 2019 from https://fred.stlouisfed.org/series/UNRATE and checked at https://data.bls.gov
[5] Personal income, 2017 and 2018. Obtained October 3, 2019 from National Income & Product Tables, 2.1, https://www.bea.gov/data/income-saving/personal-income.
[6] Number of accounts reflects emerging models for donor-advised funds, including crowdfunding and workplace giving.
[7] Projection here based on growth trends shown in data from Candid/The Foundation Center for 2013, 2014, and 2015, plus values printed for 2016 in Giving USA 2018, page 111 and for 2017 in Giving USA 2019, page 99
[8] The most recent estimate available for the number of independent foundations is 79,489 in 2015, Candid/The Foundation Center. Obtained September 24, 2019 from http://data.foundationcenter.org/
Growth in Recent Years
Donor-advised funds continued on their growth trajectory in every key metric. Grants from donor-advised fund accounts and contributions to them grew in tandem—grants at almost 19% and contributions just above 20%—and reached new highs. Grants totaled $23.42 billion and contributions totaled $37.12 billion. Charitable assets in donor-advised funds grew at a slower pace, reaching $121.42 billion. The number of new donor-advised fund accounts jumped sharply, bringing the total number of individual donor-advised funds to 728,563. The number of accounts has a significant impact on the average donor-advised fund account size.
The compound annual growth rate is included for each dollar-based metric. This measurement calculates a constant rate of return over time (in this case four years) and mitigates volatility. This measurement has been included to provide additional context and a point of comparison for the historical growth. We calculated the compound annual growth rate using all available data.
Grants Reach New High
Grants from donor-advised funds to charitable organizations reached a new high at $23.42 billion. This is an 18.9 percent increase from a revised 2017 total of $19.70 billion. The compound annual growth rate for grants from 2014 to 2018 was 17.4 percent.
Contributions Increase Significantly
Contributions to donor-advised funds in 2018 totaled $37.12 billion, also an all-time high. This number surpasses the revised 2017 value of $30.9 billion and shows an increase of 20.1 percent. The compound annual growth rate for contributions from 2014 to 2018 was 16.9 percent.
Charitable Assets Rise More Slowly
Charitable assets under management in all donor-advised funds totaled $121.42 billion in 2018, an all-time high and an 8.3 percent increase from the revised 2017 total of $112.10 billion. The growth can logically be attributed to the 20.1 percent increase in contributions, as well as investment gains through June 2018, especially at donor-advised fund charitable sponsors that have a June 30 fiscal year-end. The compound annual growth rate for charitable assets from 2014 through 2018 was 14.7 percent.
Number of DAF Accounts Increases Sharply
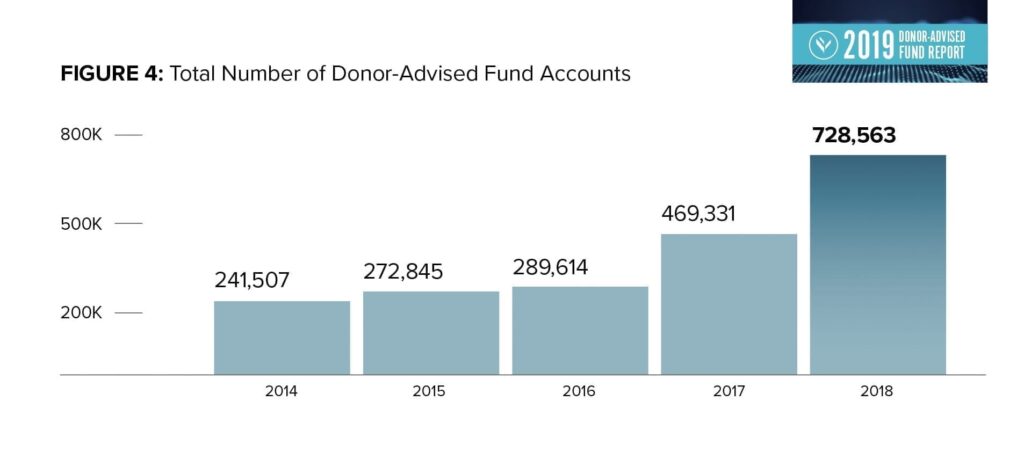
The number of individual donor-advised fund accounts again increased sharply, rising 55.2 percent in 2018 to 728,563. On average, sponsors added more than 260 new accounts during the year. However, fourteen sponsors added significantly more than the average, including one that added more than 200,000 new accounts. The compound annual growth rate for the number of donor-advised fund accounts from 2014 through 2018 was 31.8 percent.
Payout Rate Remains Above 20%
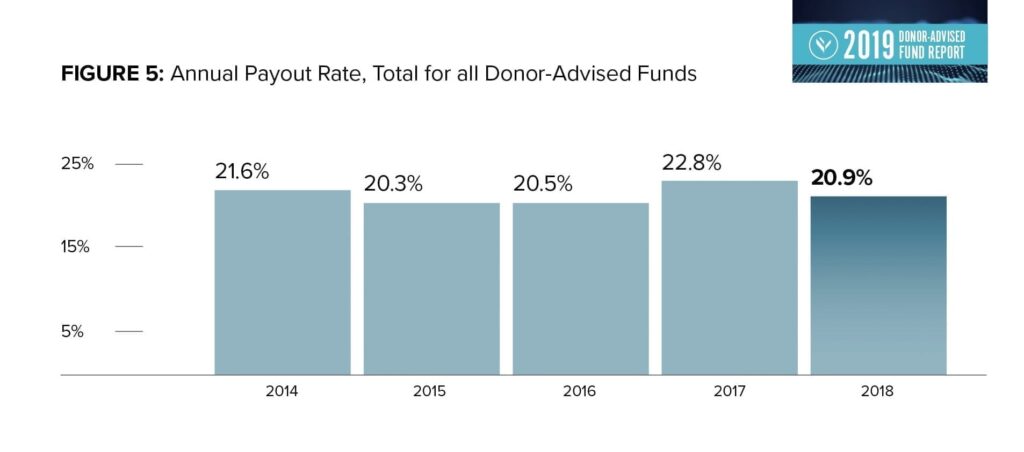
Aggregate grant payout rates from donor-advised funds annually exceed 20 percent for every year on record. The payout rate for 2018 was 20.9 percent. This is less than the payout rate of 22.8 percent for 2017.
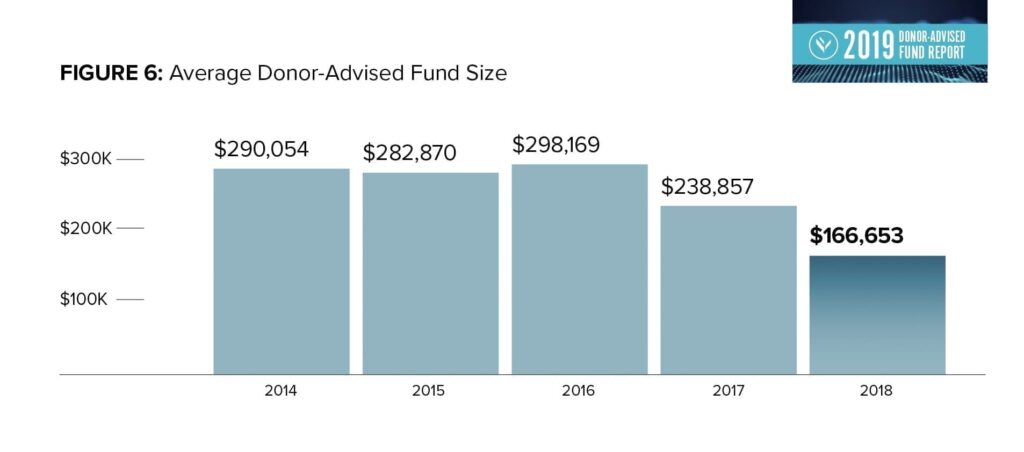
Average Donor-Advised Fund Size Drops Again
The average size of an individual donor-advised fund account is estimated to be $166,653 in 2018. This is a 30.2 percent decrease compared with the revised estimate for the 2017 average account size of $238,857. The emergence of workplace giving donor-advised fund accounts and sponsoring organizations that have no or low contribution minimums will continue to drive down the average donor-advised fund size.
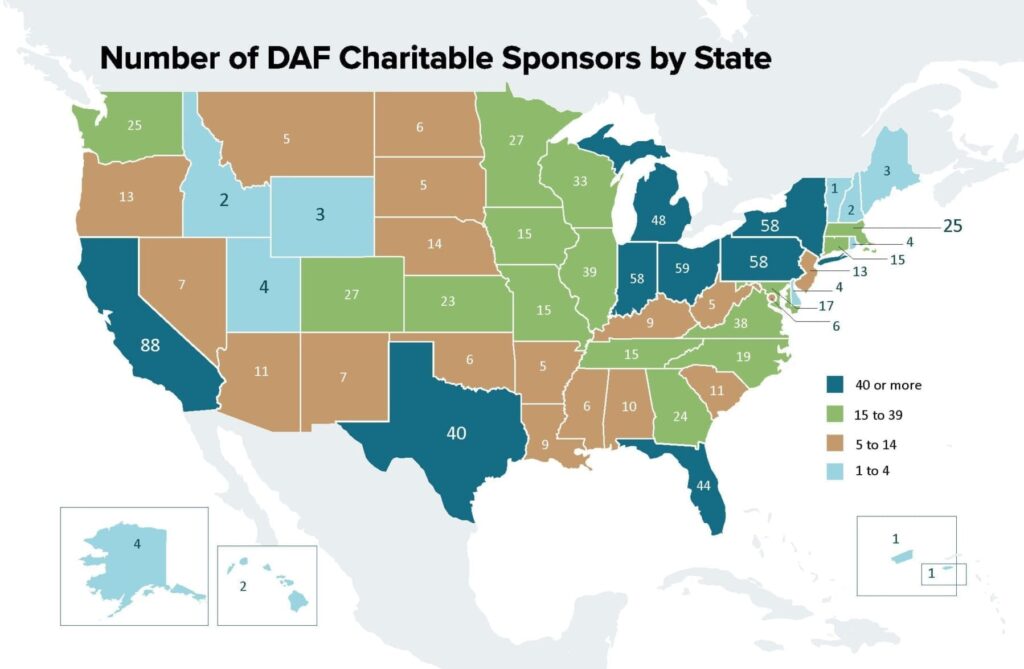
Where Are Donor-Advised Fund Sponsors?
There are donor-advised fund charitable sponsors in every U.S. state, two territories and the District of Columbia. This report analyzes data from 989 charitable sponsors. The map shows where these donor-advised fund sponsors are located across the U.S.
Comparison by Charitable Sponsor Types
There are an estimated 1.33 million registered public charities in the United States.[9] The charities that sponsor donor-advised funds tracked in this report comprise less than 1/10th of one percent of those organizations. In this report, data from three types of donor-advised fund charitable sponsors are reported: National Charities, Community Foundations and Single-Issue Charities.
The first donor-advised funds were opened in the mid-1930s and housed at Community Foundations and Jewish Federations. National donor-advised fund programs emerged in the 1990s.
The number of donor-advised fund accounts at National Charities exceeds the other two types of charitable sponsors combined. National Charities distribute more grant dollars and have higher aggregate charitable asset values. The average donor-advised fund asset size at Community Foundations is higher than at the other two types of charitable sponsors. Single-Issue Charity sponsors have the highest grant payout rate of the charitable sponsors analyzed in this study.
[9] Internal Revenue Service. 2018. IRS Data Book. Table 25: Tax-Exempt Organizations, Nonexempt Charitable Trusts, Nonexempt Split-Interest Trusts, Fiscal Year 2018. p. 57. Obtained October 4, 2019 from https://www.irs.gov/pub/irs-soi/18databk.pdf.
National Charities
This report analyzes donor-advised fund data from 54 National Charities. These national charitable sponsors had a combined 593,356 donor-advised fund accounts with total charitable assets of $72.35 billion in 2018.
The compound annual growth rate is included for each metric. This measurement calculates a constant rate of return over time (in this case four years) and mitigates volatility. This measurement has been included to provide additional context and a point of comparison for the historical growth at National Charities that offer donor-advised funds.
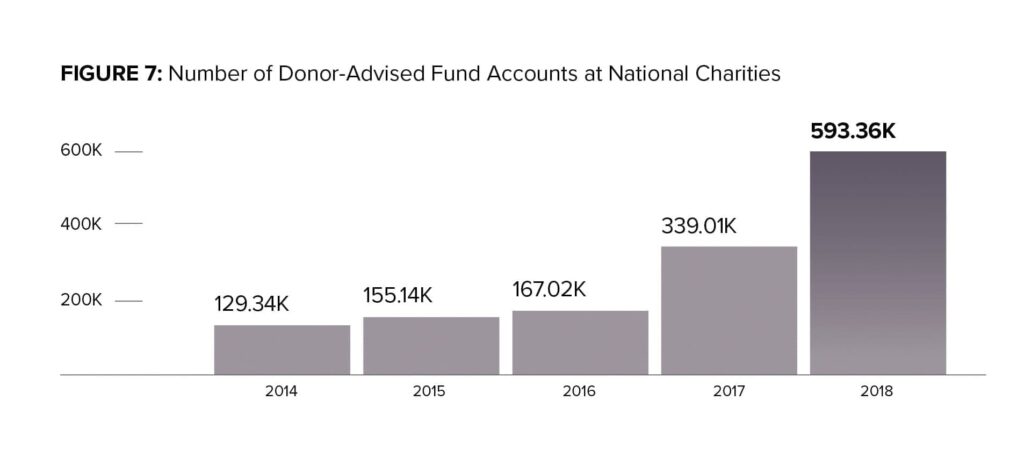
Number of Donor-Advised Funds
The number of individual donor-advised fund accounts at National Charities grew to 593,356 in 2018 from a revised 339,008 in 2017, an increase of 75 percent. This growth included increased numbers of accounts at several National Charities plus rapid growth at sponsors offering emerging models for donor-advised funds, including employer-sponsored workplace giving and employer matching. This one-year growth follows a compound annual growth rate of 46.4 percent from 2014 to 2018.
 Grants
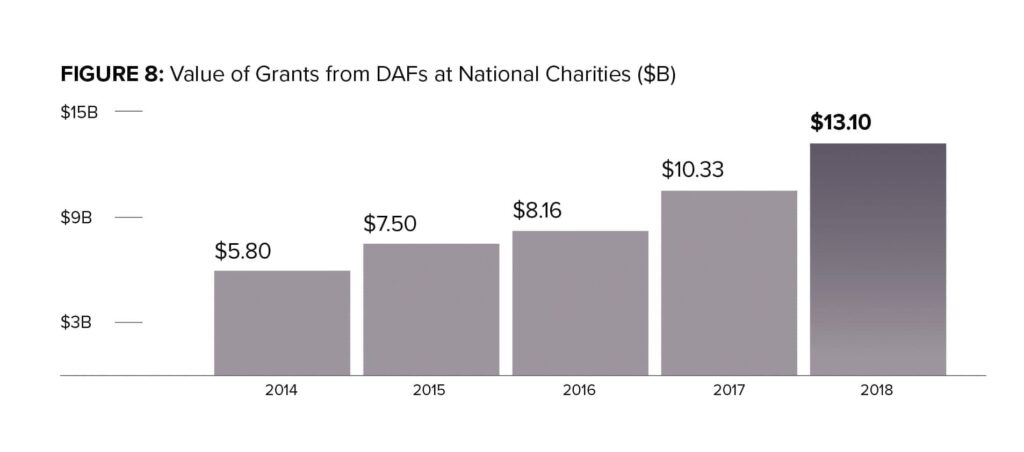
The total value of grants from donor-advised funds at National Charities to other qualified charities totaled $13.10 billion in 2018, an increase of 26.8 percent from 2017. This follows a compound annual growth rate of 22.6 percent from 2014 to 2018.
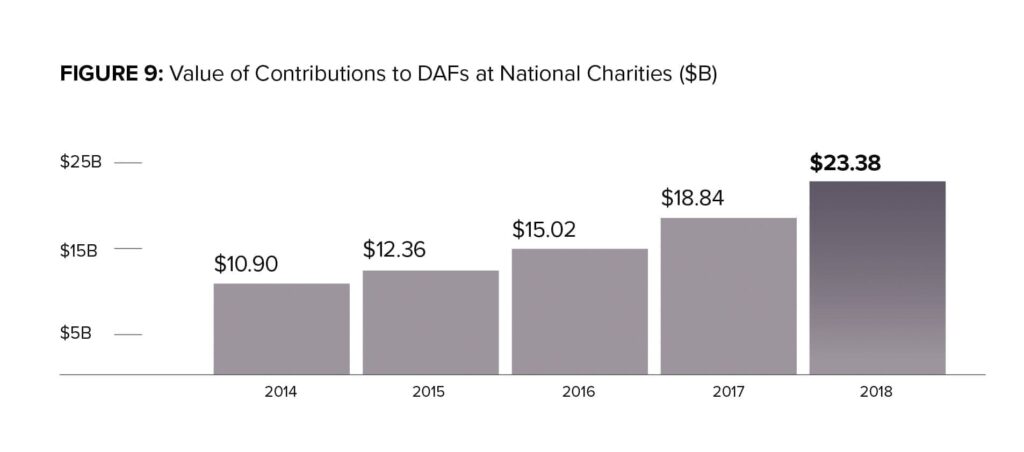
Contributions
Total contributions to donor-advised funds at National Charities reached $23.38 billion in 2018. This represents a 24.1 percent increase over the prior year. This year’s rate of growth is higher than the compound annual growth rate of 21.0 percent for contributions to National Charities from 2014 through 2018.
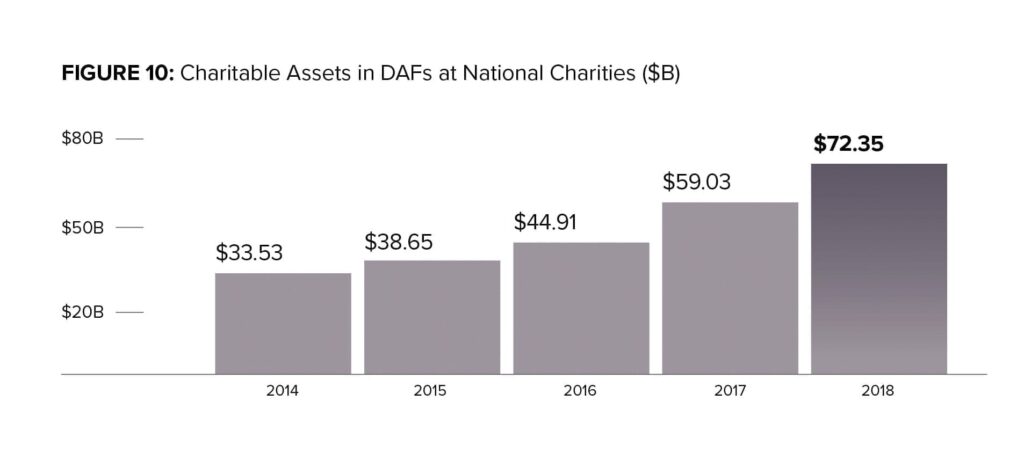
Charitable Assets
Total charitable assets in donor-advised funds at National Charities totaled $72.35 billion in 2018, a 22.6 percent increase from a revised 2017 estimate of $59.03 billion. The compound annual growth rate for charitable assets at National Charities from 2014 through 2018 was 21.2 percent.
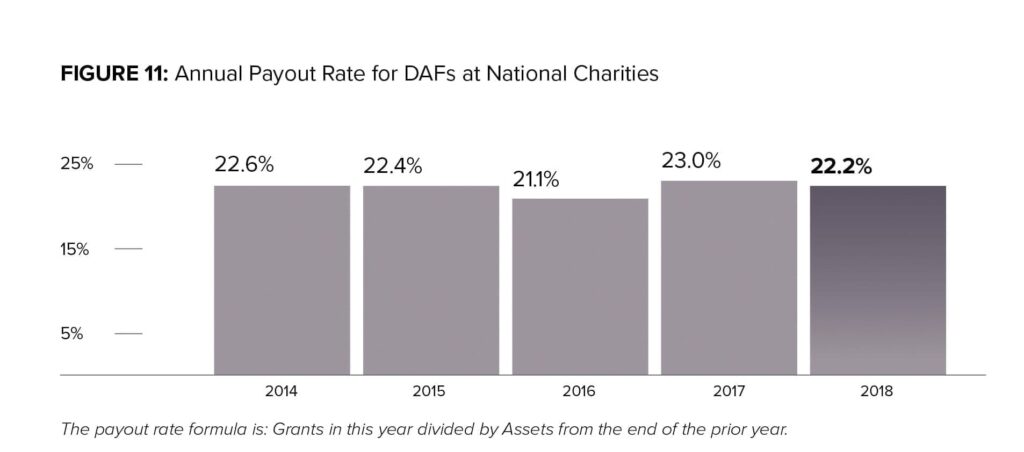
Grant Payout
The total payout rate from donor-advised funds at National Charities was 22.2 percent in 2018, a slight decrease from a 23.0 percent payout rate in 2017.
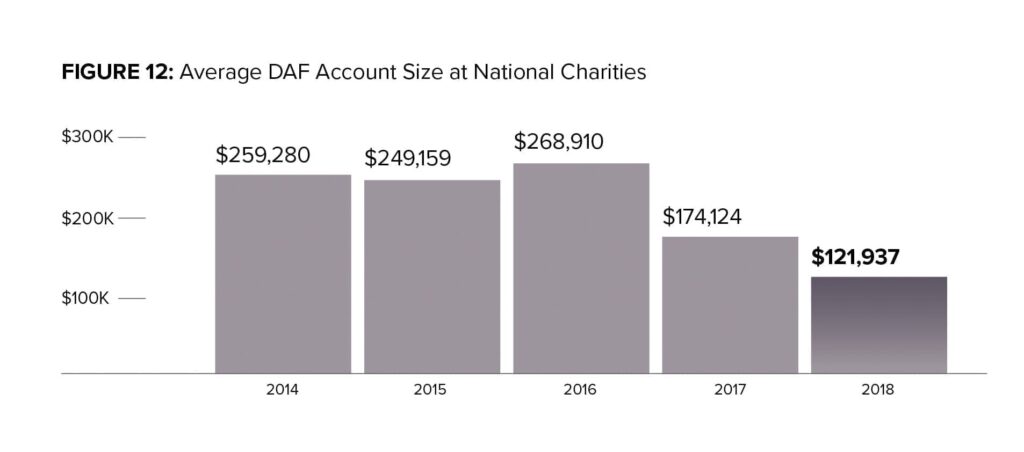
Average DAF Account Size
The average donor-advised fund account size at National Charities in 2018 is estimated at $121,937. This represents a 30.0 percent decline compared with the revised 2017 average of $174,124. This shift reflects the increase in many smaller donor-advised fund accounts at National Charities, including newer charitable sponsors.
Community Foundations
This report analyzes donor-advised fund data from 603 Community Foundations, which have 77,234 donor-advised fund accounts with charitable assets totaling $33.87 billion.
The compound annual growth rate is included for each metric. This measurement calculates a constant rate of return over time (in this case four years) and mitigates volatility. This measurement has been included to provide additional context and a point of comparison for the historical growth of donor-advised funds at Community Foundations.
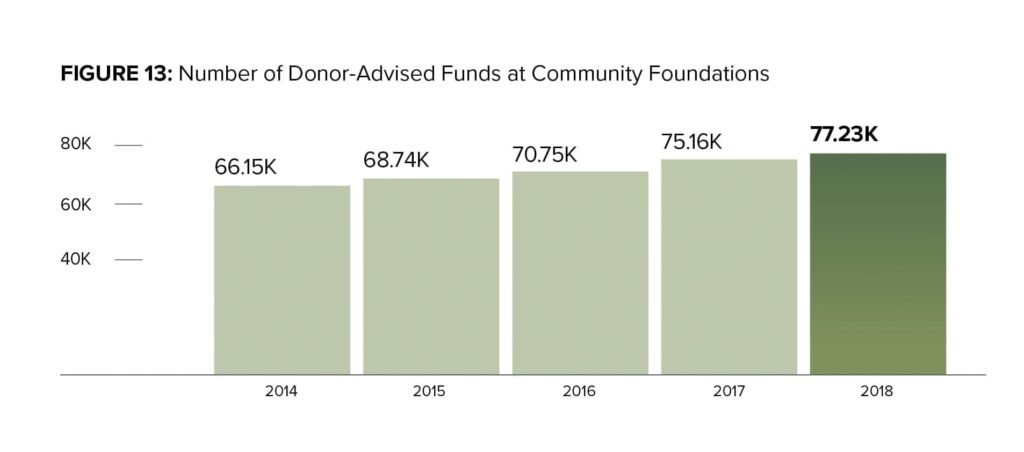
Number of Donor-Advised Funds
The number of individual donor-advised funds at Community Foundations was 77,234 in 2018, an increase of 2.8 percent when compared with 2017. The compound annual growth rate from 2014 through 2018 was 3.9 percent.
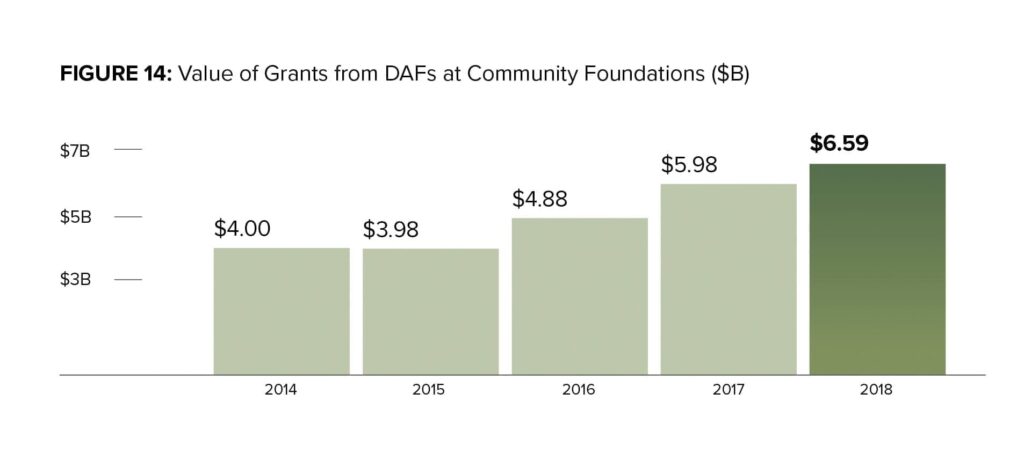
Grants
Grants from donor-advised fund accounts at Community Foundations totaled $6.59 billion in 2018, up from $5.98 billion granted in 2017—a 10.2 percent increase. The compound annual growth rate from 2014 to 2018 was 13.3 percent.
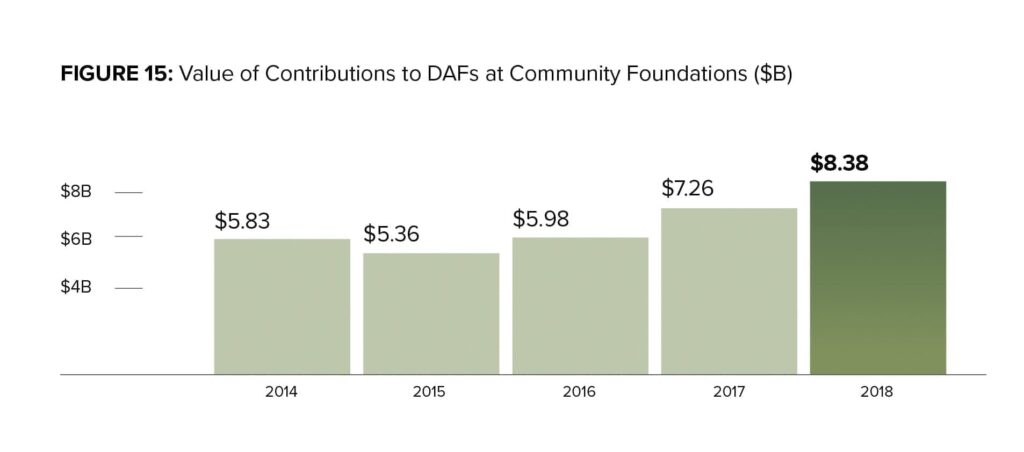
Contributions
Total contributions to donor-advised funds at Community Foundations were $8.38 billion in 2018, a 15.4 percent increase over the prior year. This is considerably higher than the compound annual growth rate from 2014 to 2018 of 9.5 percent.
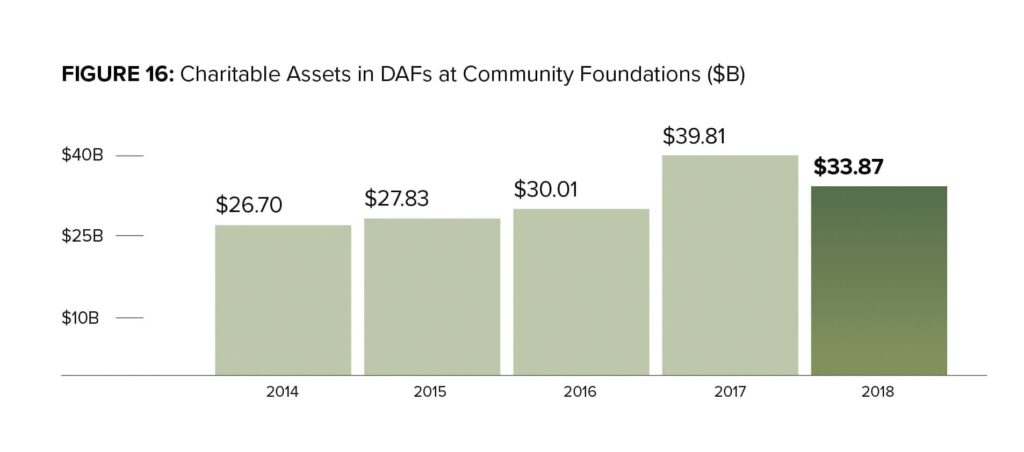
Charitable Assets
Charitable assets in donor-advised funds at Community Foundations totaled $33.87 billion in 2018, a 14.9 percent decrease from $39.81 billion in 2017. The compound annual growth rate for 2014 through 2018 was 6.1 percent. This is the first decline in charitable assets at any type of charitable sponsor since the economic recession in 2009. Most of this decline can be attributed to revised methods of reporting the value of some types of investments. For example, one of the largest community foundations in the country changed its accounting policies for digital currencies. Sixty community foundations (10 percent of the 603 tracked) reported a decline in charitable assets. Charitable assets in donor-advised funds at those 60 community foundations accounted for 36 percent of total charitable assets at all 603 community foundations.
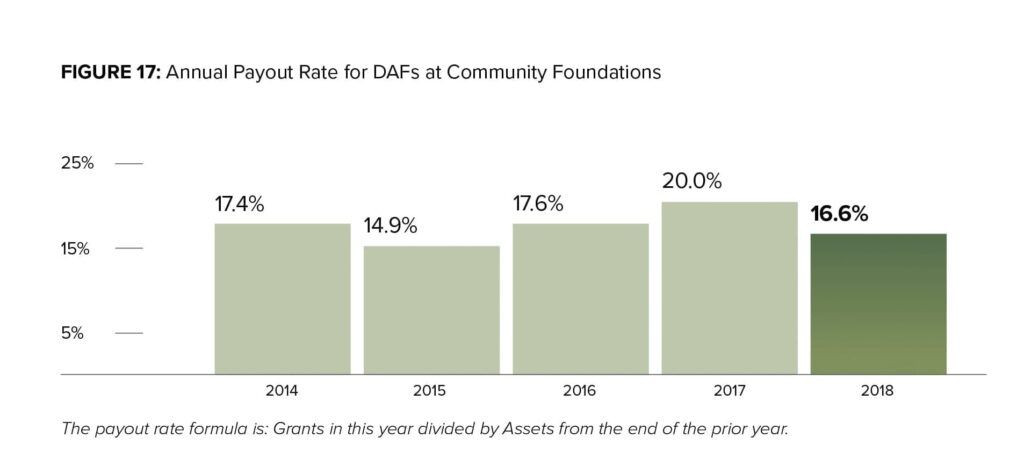
Grant Payout
The total payout from donor-advised funds at Community Foundations was 16.6 percent* in 2018, a decrease from 20.0 percent in 2017.
[Editor’s note: this data point was revised on 11/20/19]
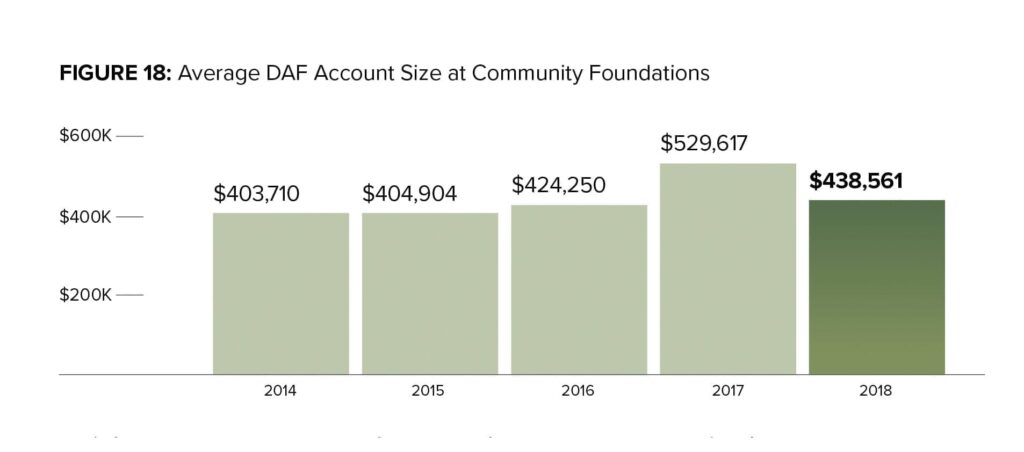
Average DAF Account Size
The average account size of donor-advised funds at Community Foundations declined to $438,561 in 2018. This represents a 17.2 percent decrease from the 2017 average of $529,617. This shift reflects the decline in assets previously noted plus the 2.8 percent growth in the number of donor-advised funds.
Single-Issue Charities
This report analyzes data for 332 Single-Issue Charity sponsors. This type of charitable sponsor held 57,973 donor-advised fund accounts with charitable assets totaling $15.19 billion.
The compound annual growth rate is included for each metric. This measurement calculates a constant rate of return over time (in this case four years) and mitigates volatility. This measurement has been included to provide additional context and a point of comparison for the historical growth of donor-advised funds at Single-Issue Charities.
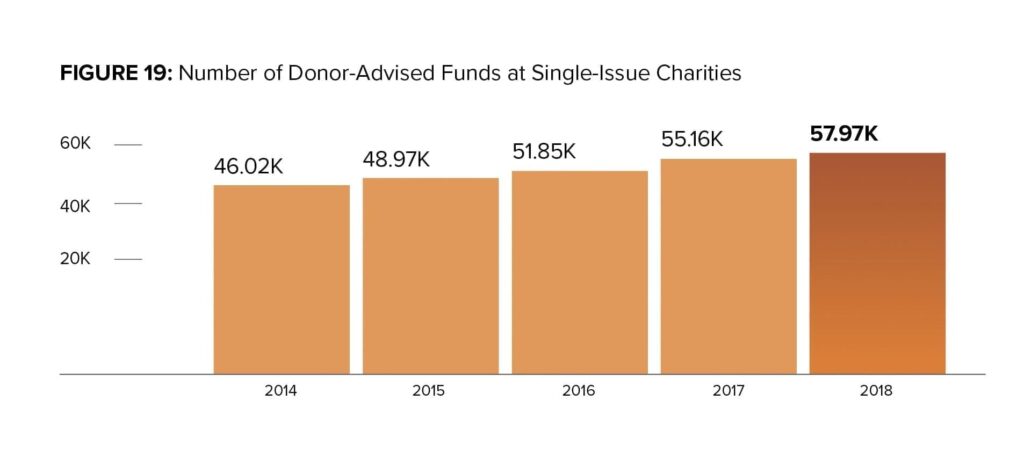
Number of DAF Accounts
There were 57,973 individual donor-advised funds at Single-Issue Charities in 2018. This number is a 5.1 percent increase compared with 2017, when there were 55,159 individual donor-advised funds. The compound annual growth rate from 2014 to 2018 was 5.9 percent.
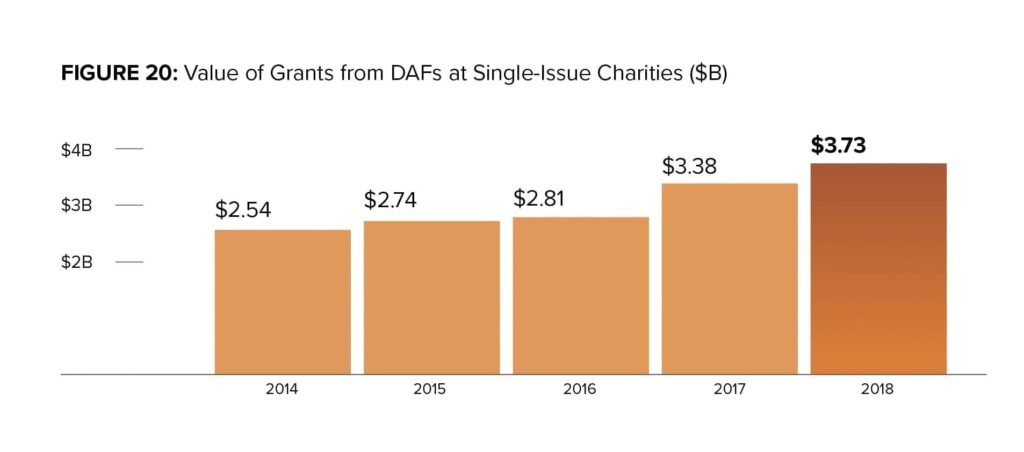
Grants
Grants from donor-advised funds at Single-Issue Charities totaled $3.73 billion in 2018, up from $3.38 billion in 2017. This is a 10.3 percent increase. The compound annual growth rate from 2014 to 2018 was 10.0 percent.
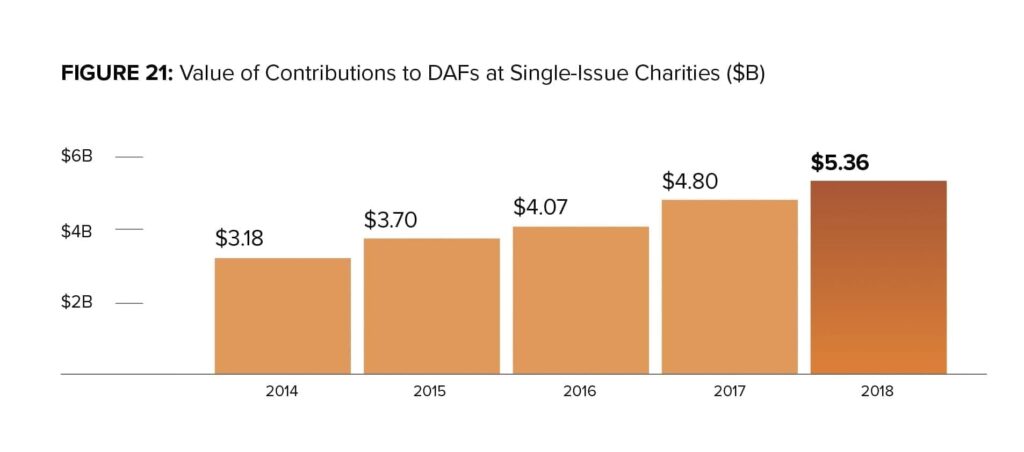
Contributions
Contributions to donor-advised funds at Single-Issue Charities totaled $5.36 billion in 2018. The change in contributions from 2017 to 2018 represents an increase of 11.7 percent from the revised total of $4.80 billion for 2017. The compound annual growth rate from 2014 to 2018 was 13.9 percent.
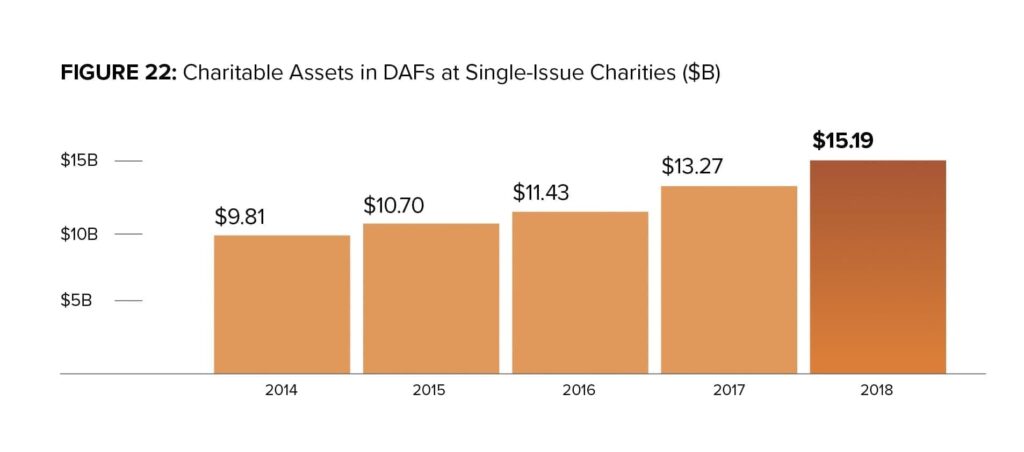
Charitable Assets
Charitable assets in donor-advised funds at Single-Issue Charities totaled $15.19 billion in 2018. This is an increase of 14.5 percent from a revised amount of $13.27 billion in 2017. The compound annual growth rate from 2014 to 2018 was 11.5 percent.
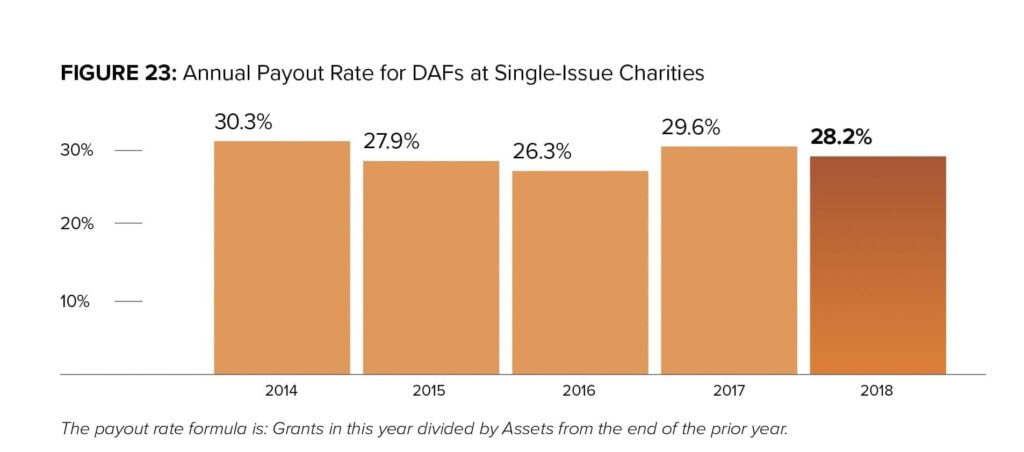
 Grant Payout
The total payout from donor-advised funds at Single-Issue Charities was 28.2 percent in 2018, a drop from a 29.6 payout rate in 2017.
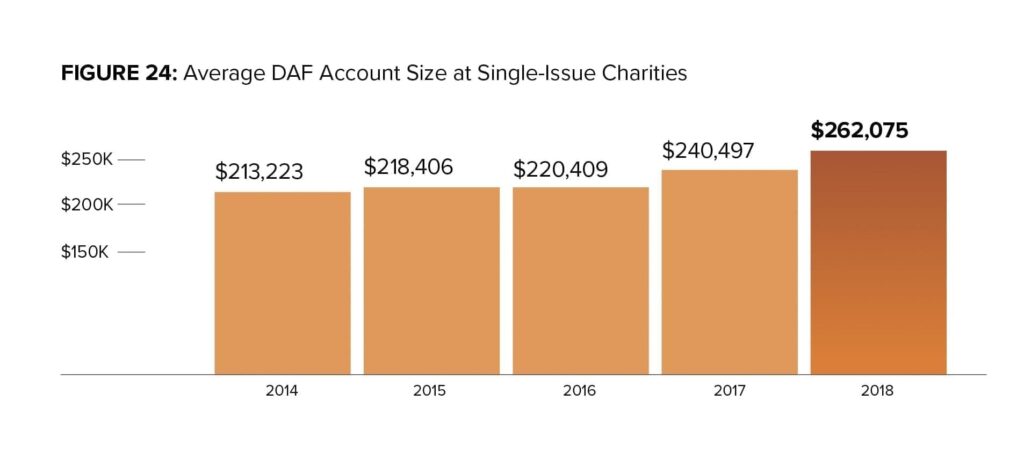
Average DAF Account size
The average donor-advised fund size at Single-Issue Charities was $262,075 in 2018. This represents an increase of 9.0 percent compared with the 2017 average of $240,497.
Projections and Observations
In last year’s report, we predicted growth in contributions to donor-advised funds and grants from donor-advised funds, particularly at National Charities. This year’s data supports those predictions.
Grantmaking increased overall at each type of charity that sponsors donor-advised funds, with the rate of growth at National Charities more than double the other two types of sponsors. We see 26.8 percent growth in National Charities’ grants between 2017 and 2018, which follows a similarly high rate of growth from 2016 to 2017. In fact, grants from donor-advised funds at National Charities in 2018 equal approximately one quarter of grants from independent foundations, despite the fact that National Charities have less than 10 percent of the assets of independent foundations.
Last year, we also noted that the Tax Cuts and Jobs Act of 2017, which Congress passed in December 2017, spurred charitable giving at the end of the 2017 calendar year. The impact of this spike in giving could not be fully realized in our data set until this report because of the charitable sponsors’ various fiscal year schedules. To recap: The new laws went into effect on January 1, 2018 and doubled the standard tax deduction for single and joint tax filers, effectively eliminating the need of many Americans to itemize deductions. As such, many Americans opted to give before December 31, 2017. The data from that time is now fully captured. Contributions to all donor-advised funds rose by a combined $5 billion in 2017 or 23 percent. In 2018, contributions rose again by more than $6.2 billion, or over 20 percent. Both periods outpaced the compound annual growth rate from 2014 to 2018. Also, more individual donor-advised fund accounts were created than ever before. Not enough time has passed to demonstrate a trend line, but it is clear that many donors found that donor-advised funds offered a solution to the challenges or changes presented by the new tax laws.
Donors find donor-advised funds convenient. Sponsors are introducing new models for donor-advised fund giving, including employer-sponsored donor-advised fund accounts that allow employees to make payroll deductions for charitable giving and/or for employers to match employee giving. Online tools like mobile apps, online transactions and credit card processing have facilitated donor-advised fund giving in unprecedented ways. These changes have led to increased accessibility for donors and charities. Lower dollar minimums to set up a donor-advised fund account have helped drive adoption for younger donors. Mobile applications that easily allow donors either to add to or grant from their donor-advised fund account and tools to help verify charitable registration for eligible grantees mean donors can respond to charitable impulses quickly using their donor-advised fund.
What Lies Ahead?
We expect that grantmaking from donor-advised funds to charitable organizations will continue to grow at a consistently high rate. In 2018, growth in contributions to donor-advised funds outpaced the growth rate of grants from donor-advised funds to charities. This reverses a four-year trend where grants grew faster than contributions. One factor for this may be “bunching.” For donors whose giving was impacted by tax law changes, “bunching” or effectively “pre-funding” their giving in a donor-advised fund allowed them to take advantage of the charitable tax deduction while consistently supporting their favorite charities. Donors who bunched their donations now may have several years’ worth of charitable assets in their donor-advised fund accounts and may continue to grant from them at a high rate. If true, we will see that grant growth will again outpace contribution growth in the next report.
We also expect that the emerging models for donor-advised funds—such as workplace giving using donor-advised funds and low- or no-minimum donor-advised fund accounts—will play a significant role in the number of individual donor-advised fund accounts and, as a result, drive down the average donor-advised fund account size.
Our projections are based on NPT’s experience and observations over the past year and on empirical data we have collected.
Summary
Donor-advised funds continue to grow in all key metrics. Grantmaking increased by almost 19 percent. Aggregate payout rates have been near or above 20 percent since we first started collecting data in 2007. It is clear that donors who use this type of giving vehicle continue to support charitable organizations and causes with their donor-advised funds.
Methodology
The 2019 Donor-Advised Fund Report examines a total of 989 charities registered under Section 501(c)(3) of the Internal Revenue Code that sponsor and/or manage donor-advised funds and that reported at least $1 in assets in any year from 2014 through 2018. These include the following organizations:
- National Charities: organizations that are independent or are commercially affiliated and national in reach; not focused on a particular region; and do not have a specific religious and/or focus area. Examples include National Philanthropic Trust, Fidelity Charitable Gift Fund, and Renaissance Charitable Foundation.
- Community Foundations: organizations that have a specific geographic or regional focus. Examples include Cleveland Foundation, Delaware Community Foundation, and Community Foundation of the Ozarks.
- Single-Issue Charities: organizations that support a specific religious faith; focus on a particular issue area or cause; or fund a specific institution. Examples include Jewish Federation of Rhode Island, San Diego Human Dignity Foundation, and Stanford University.
Primary Data Source
The primary source for each charitable sponsor’s assets, contributions, grants, and total number of donor-advised funds is their IRS Form 990. The Form 990 is the annual information return that charities file with the Internal Revenue Service. For those organizations that filed Form 990 returns for FY2009 and later, this information is found in Schedule D. For organizations that filed returns prior to FY2008, this may include information found on Schedule D. National Philanthropic Trust (NPT) obtained copies of Form 990 via Candid/GuideStar. In select cases, NPT obtained copies of Form 990 from the Candid/Foundation Center’s 990 Finder or the organization directly.
Since organizations have varied fiscal years, which may end March 31, June 30 or December 31, data was recorded in the fiscal year in which the charity filed the 990 Form with the IRS and posted on GuideStar. For example, whether an organization’s fiscal year ends on March 31, 2018 or December 31, 2018, the data will be recorded as 2018. This is consistent with Candid/GuideStar’s reporting process in date stamping all Form 990s for the organizations’ respective fiscal years.
Continuous Data Updates
Starting in the 2014 edition of the Donor-Advised Fund Report, NPT compiled a larger file covering more donor-advised fund sponsors. In this edition, the data are again compiled from that larger file. In addition, the review of data from Candid/GuideStar showed some charities with donor-advised funds that had not previously been included. The data collection process included obtaining IRS Forms 990 back to 2007 for any entity added to the donor-advised fund data set.
For this 2019 edition, NPT reviewed 989 organizations that reported at least $1 in assets from fiscal year 2014 through fiscal year 2018: 54 National Charities, 603 Community Foundations and 332 Single-Issue Charities. For this edition, NPT used the most recent data from IRS Forms 990. For some organizations whose fiscal year 2018 data was not yet publicly available, we received the data directly from the charity.
NPT maintains a time series of all key data points (charitable assets, grants, contributions and accounts) back to FY2007. Some of the organizations in the historical file have closed or merged. There are more than 1,075 charities in the historical file.
Payout Calculation
Payout from donor-advised funds is calculated to resemble how Candid/The Foundation Center estimates the grant payout rate for private foundations.
Candid/The Foundation Center published a report about how payout rate is determined using rules established in the tax code. The tax code allows private foundations to include as “qualified distributions” certain expenses associated with grantmaking and other payments made for charitable purposes (e.g., conferences, technical assistance for grantees, and other expenses). Those expenses are too complex to track accurately for 75,000+ private foundations. In its work, the Foundation Center uses a simpler approach, which this report now replicates.
In the Foundation Center method, the current year’s grants are divided by investable assets held at the end of the prior year.
Acknowledgements
This report was prepared by National Philanthropic Trust under the guidance of Eileen R. Heisman, President and CEO; Andrew W. Hastings, Chief Development Officer; Bill Webster, Chief Marketing Officer; and NPT’s Marketing and Communications Department. Melissa S. Brown of Melissa S. Brown Associates, LLC provided analysis and writing services. Linh Preston of Fogus Consulting & Writing assisted with data analysis and proofreading. Erin Hoyes of Weldon Communications provided additional research and writing services. Fiona Kennedy and Tara Mays provided research assistance.
NPT gratefully acknowledges all the organizations that shared their donor-advised fund statistics and information. For permission to cite or reproduce this report, please contact Bill Webster, NPT’s Chief Marketing Officer, at bwebster@nptrust.org or 215.277.3010.
Downloads
Archived DAF Reports
- Download the 2018 Report
- Download the 2017 Report
- Download the 2016 Report
- Download the 2015 Report
- Download the 2014 Report